Homie

Designing a B2B SaaS to Help RE Agents Align Confidently with Clients on Property Comparisons and Pricing

  • High fidelity Homie dashboard
  • High fidelity Homie input fields
  • High fidelity Homie property listing
  • High fidelity Homie properti sales projection UI, top part
  • High fidelity Homie property sales projection UI, bottom part
  • High fidelity Homie dashboard, bottom part
  • High fidelity Homie dashboard
  • High fidelity Homie input fields
  • High fidelity Homie property listing
  • High fidelity Homie properti sales projection UI, top part
  • High fidelity Homie property sales projection UI, bottom part
  • High fidelity Homie dashboard, bottom part
  • High fidelity Homie dashboard
  • High fidelity Homie input fields
  • High fidelity Homie property listing
  • High fidelity Homie properti sales projection UI, top part
  • High fidelity Homie property sales projection UI, bottom part
  • High fidelity Homie dashboard, bottom part

Overview

Homie is a SaaS concept designed to help real estate agents in Milan work smarter.

I focused on creating a solution that addresses challenges around property comparisons when managing buyers and pricing strategies with sellers, enabling faster and more confident decision-making.

Role

I’m a Product Designer who loves a good challenge and solving real problems.

Homie was my opportunity to reimagine real estate workflows—by understanding users’ pain points, brainstorming solutions, and creating a design that truly adds value.

Skills

User Experience

Visual Design

Design Systems

User testing/Research

Prototyping

Timeline

2 Weeks

While RE SaaS are widely used in Milan, agents still struggle with gaps in functionality that could make their work more efficient and impactful.

This leaves them with tools that fail to address two major challenges: managing clients' unrealistic price expectations and efficiently comparing properties.

As a result, clients may experience doubts during decision-making, which reduces trust and transparency, and ultimately impacts the business by lowering the chances of closing deals.

image of real estate agent dealing with clients

The Plan

Transform the way agents and clients connect over property decisions.

An intelligent comparison tool that highlights key property differences and real-time price projections, allowing agents to guide their clients, building confidence and accelerating thoughtful decision-making.

image of real estate agent using Homie to effectively manage clients

Milestones

Build confidence

Prove that there is a problem affecting the performance of real estate agents and, consequently, the business as a whole. Articulate the problem(s), define the use cases, prove they are real, and identify a way to and identify a way to solve them.

Create value

Design a solution that solves the problem(s), saves time for agents and clients, instill confidence, speed up decisions, and leads to more successful and efficient deals.

image of milestones of the project

Build confidence

Performed extensive back-office research plus some interviews to assess the opportunity

I dove deep into the data to break down the market, competitors, and alternatives. My approach focused on challenging my own assumptions rather than confirming them, I wanted the research to reveal any flaws in my thinking. I also ran interviews with target users, which, surprisingly, turned out to be trickier than expected.

multiple screenchots of back office research insights

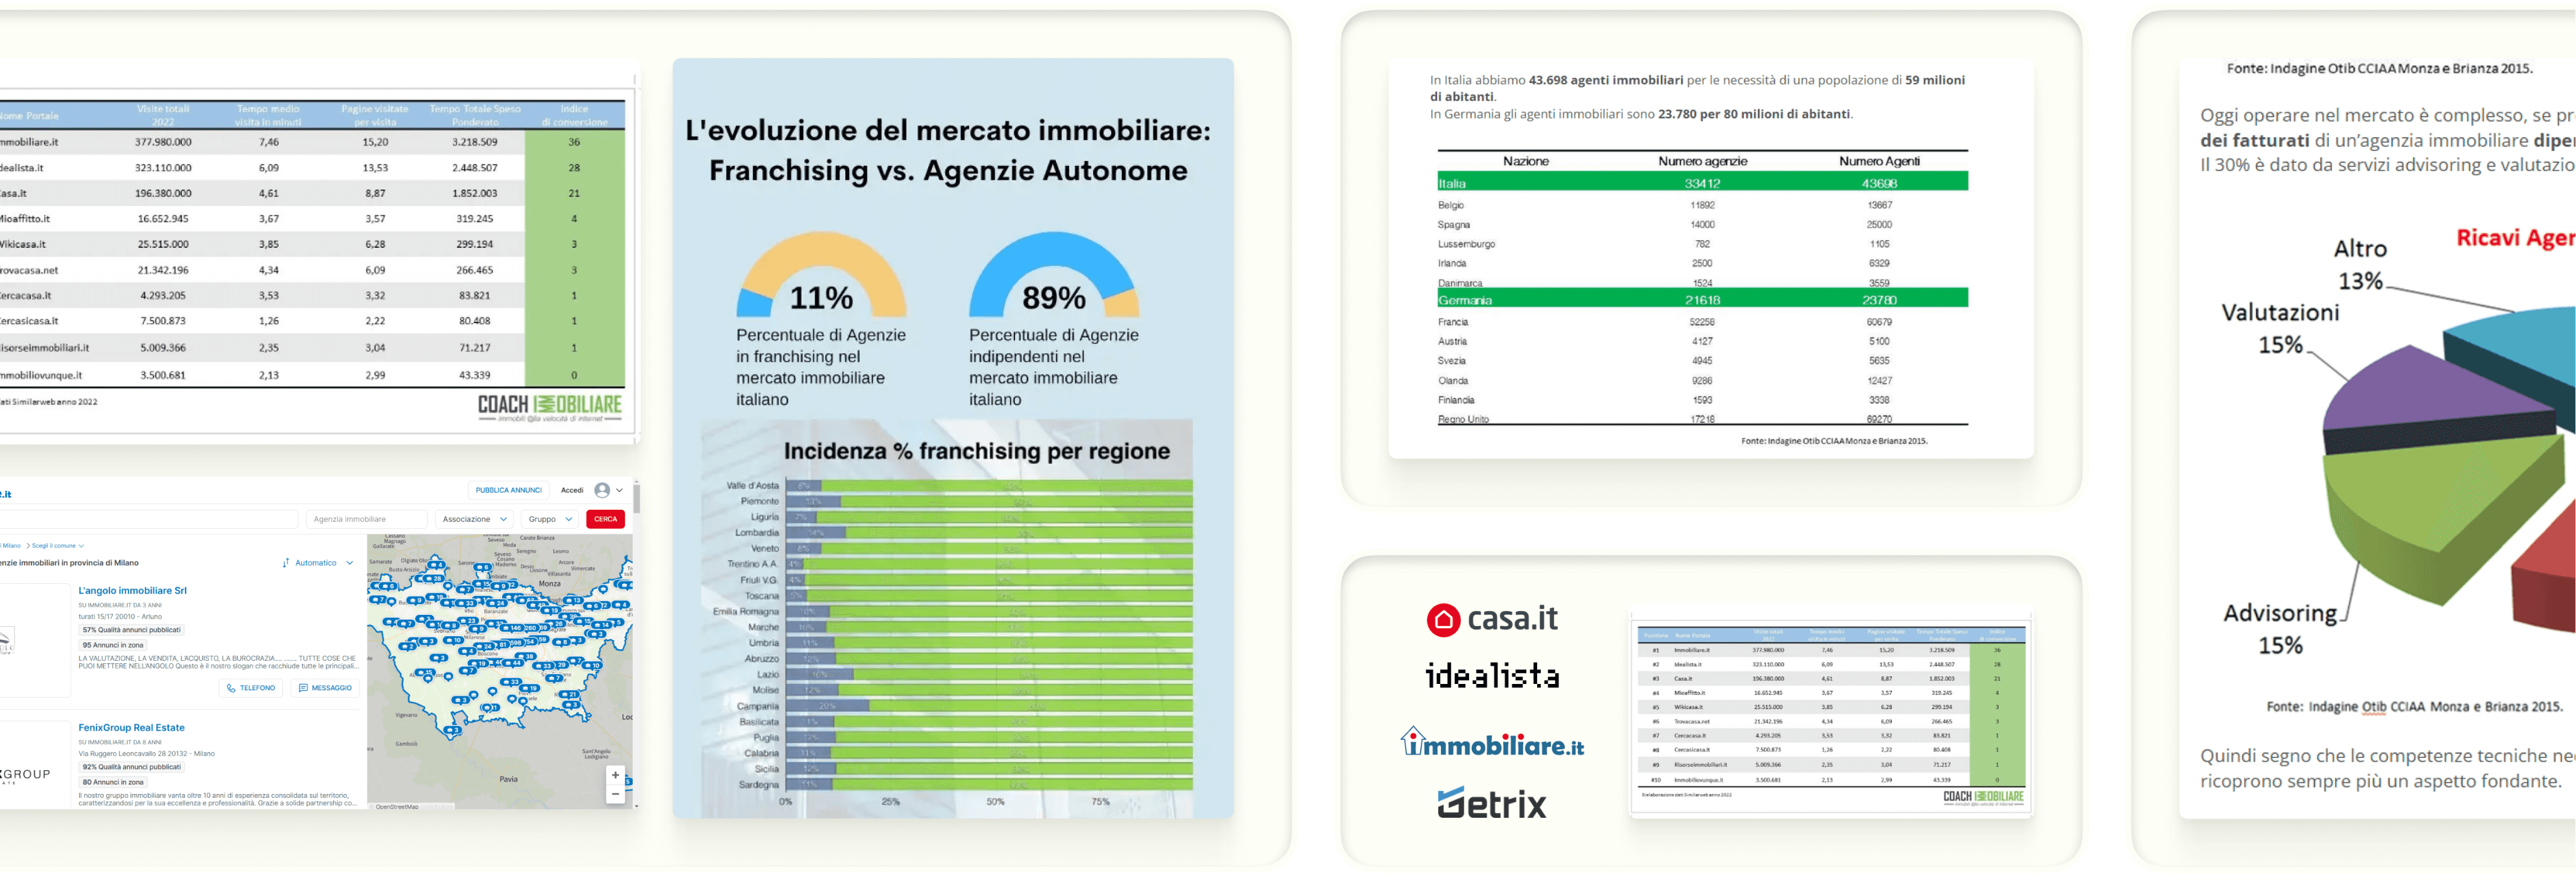
Italy has over 53,000 real estate agents, with 2,500 to 3,000 agencies in Milan—roughly 7–8% of the total market. Smaller agencies typically have 3 to 5 agents, while larger ones can have 10 or more. The growing digital adoption in real estate signals a promising outlook for tools like Homie.

Build confidence

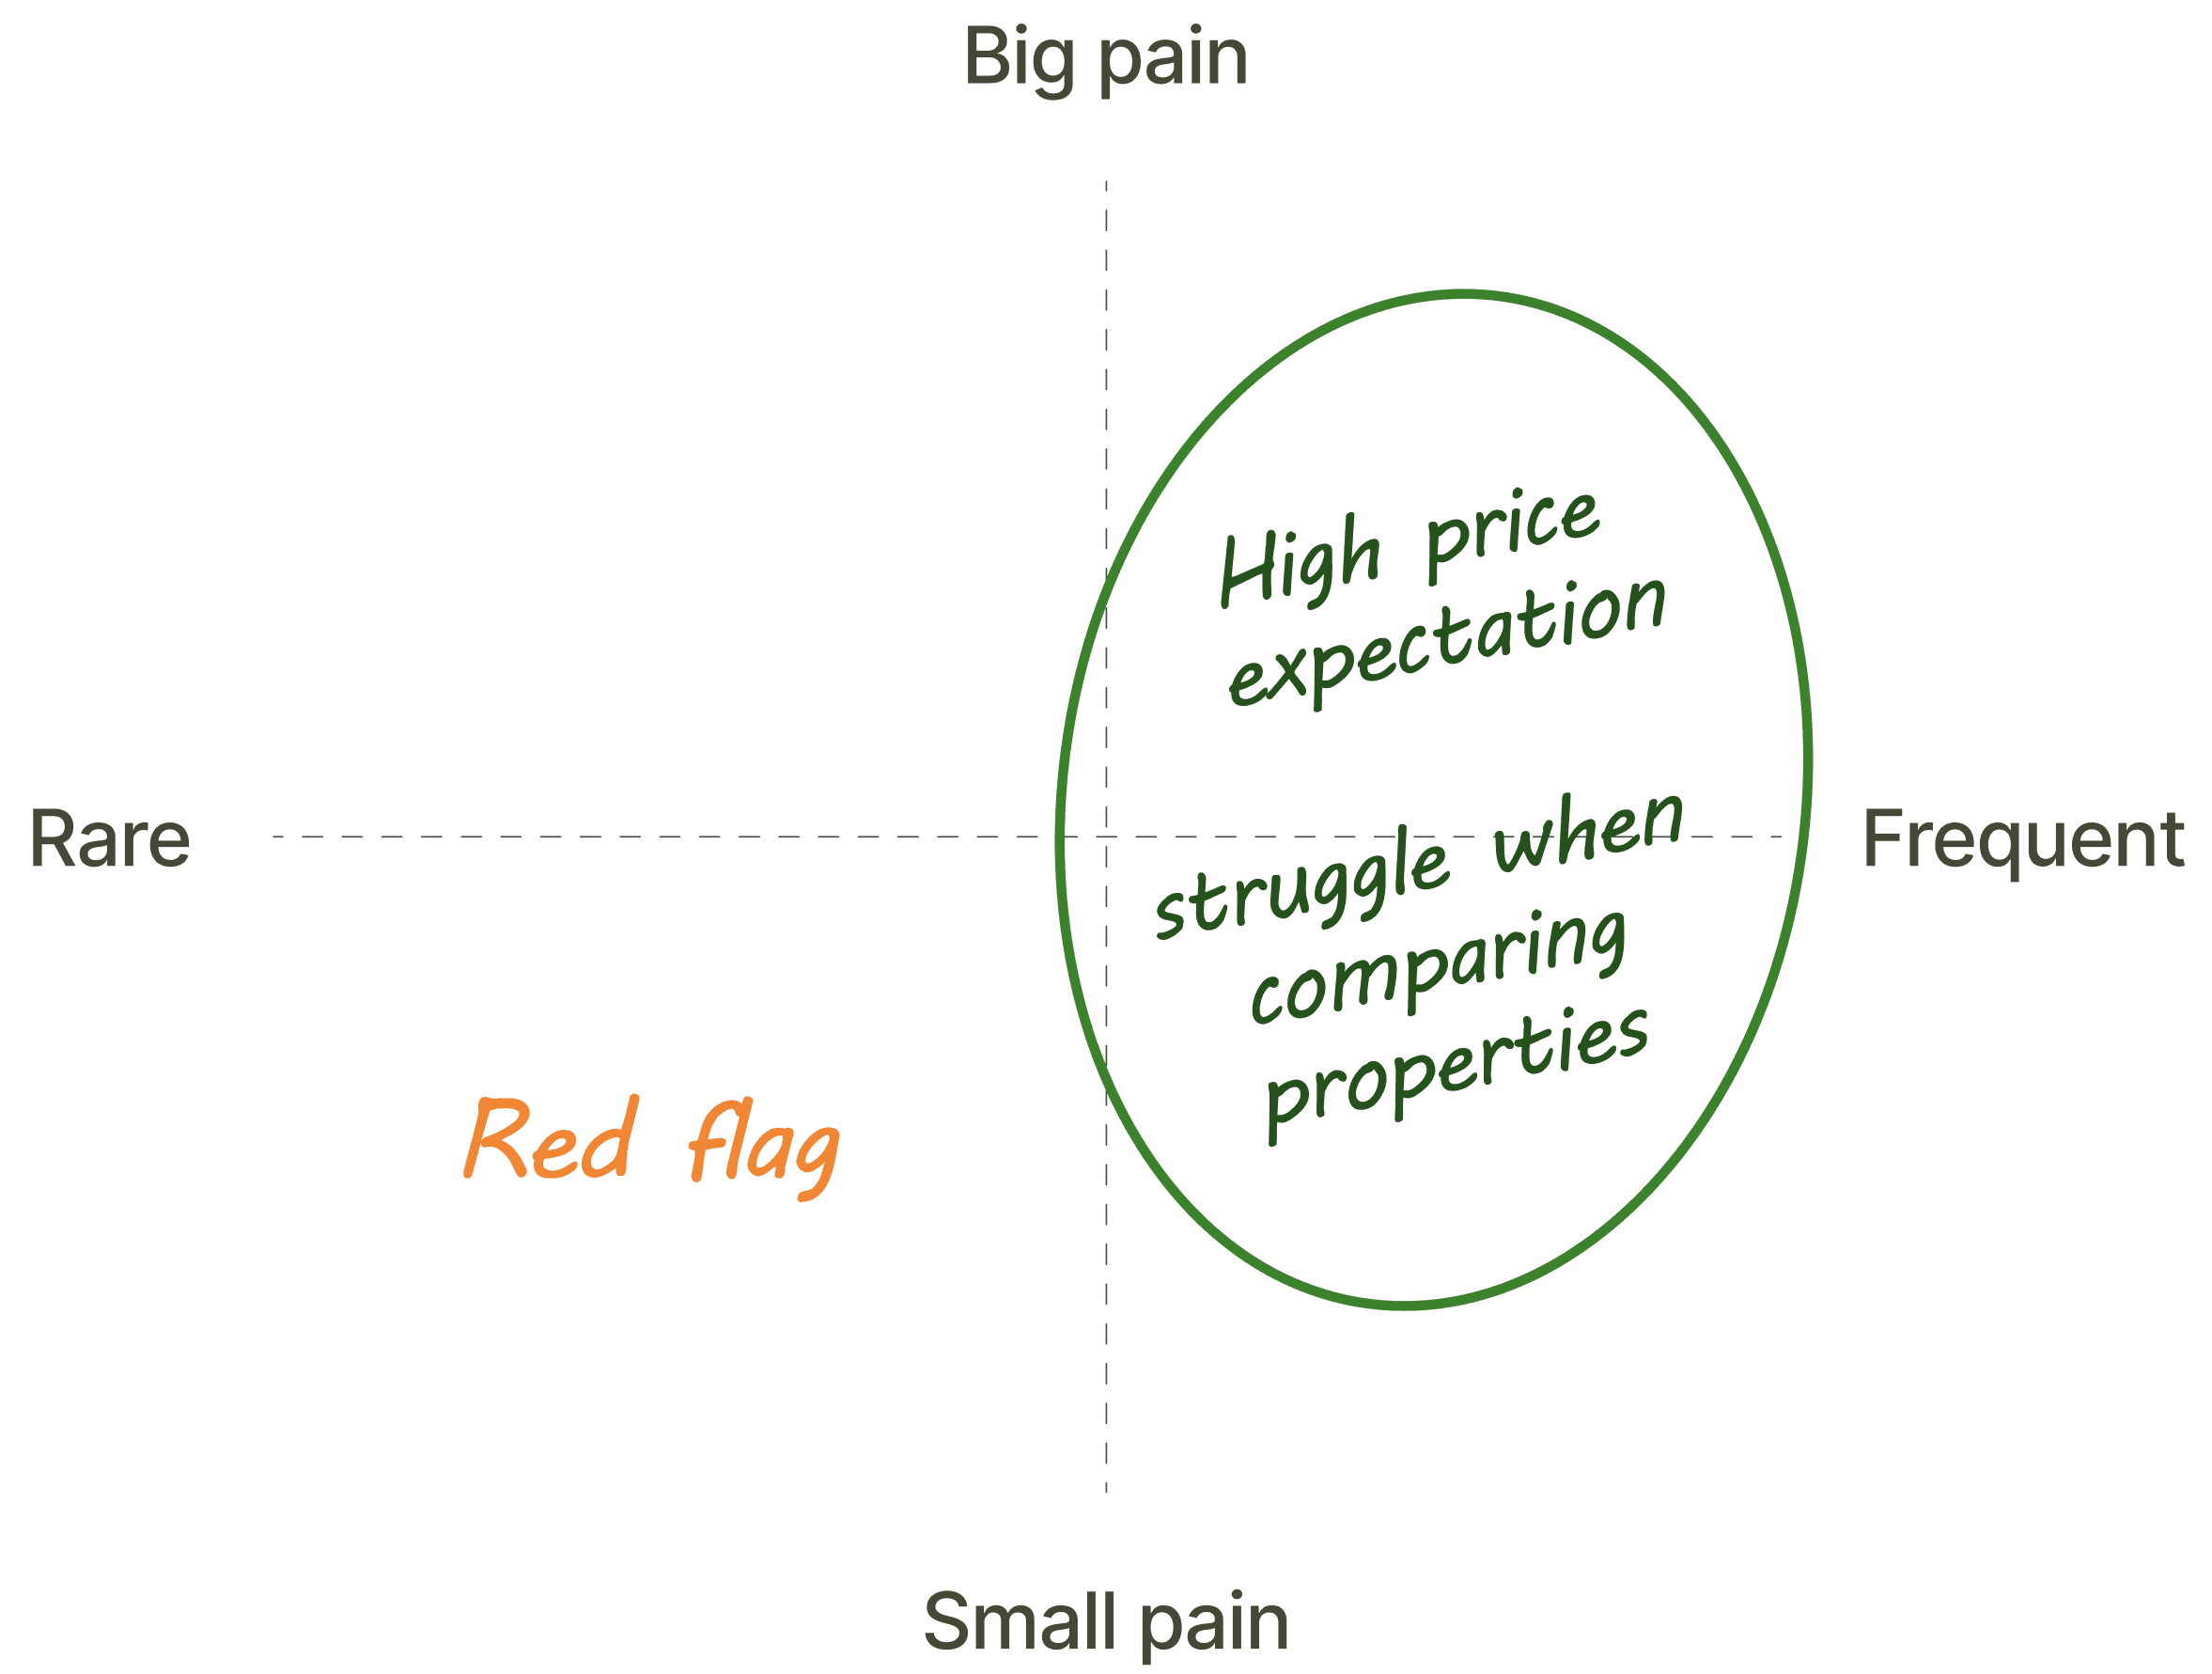
Is this problem worth solving? Frequency and pain level are key

To validate my hypothesis, I explored how often agents struggle with guiding buyers through property comparisons and handling sellers with unrealistic price expectations. More importantly, I wanted to understand how much these issues impact their work. This would help me decide if a solution was justified.

image of frequency and pain level graph

Build confidence

Identified Common Challenges in Property Comparisons and Managing Seller Expectations

Talked to over 15+ people in RE sector comprendiing RE agents, RE specialists and RE agency owners.

Price Expectations vs. Market Reality

• Around 60% of sellers initially overprice their properties.

• To retain clients, agents sometimes accept inflated prices, delaying sales.

Market Trends and Price Fluctuations

• Difficulty keeping up with real-time market trends.

• While Europe is seeing a rise in PropTech adoption for predictive pricing and sales forecasting, in Italy, these technologies are mainly used by large real estate agencies. Small and mid-sized agencies rarely adopt them due to cost and expertise barriers.

Data Fragmentation

• Fragmented real estate tools make information management inefficient.

• MLS platforms often lack key features like property comparison.

• Manual and repetitive property evaluation processes reduce productivity.

Build confidence

Defined 2 core use cases based on research

image of a laptop showing a house

Scenario 1

Client interested in buying a property

Property Comparison: use side-by-side property comparison tool, including all key features, helping agents guide buyers quickly and effectively.

image of keys of a house

Scenario 2

Client wants to sell a property

Predictive Analytics: leverage predictive tools to forecast time-to-sale based on market trends and economic factors, enabling agents to keep clients in the loop and set realistic expectations.

Build confidence

Cutting through the noise, an MVP to align prices and compare properties

It's common for RE agents to face friction when dealing with clients, particularly when it comes to comparing properties and aligning client price expectations with market realities. My goal was to strip away the complexity and build an MVP that tackled these two challenges head-on.

● A dashboard as the central hub, surfacing key data and past actions.

● Two streamlined flows branching from the dashboard:

Buying: A side-by-side property comparison tool.

Selling: Data-driven price projections to support negotiations.

image of the core user flows of Homie

Milestones

Build confidence

Prove that there is a problem affecting the performance of real estate agents and, consequently, the business as a whole. Articulate the problem(s), define the use cases, prove they are real, and identify a way to and identify a way to solve them.

Create value

Design a solution that solves the problem(s), saves time for agents and clients, instill confidence, speed up decisions, and leads to more successful and efficient deals.

image showing milestones reached and milestone that come

Create value

Designed and prototyped in a few days the 2 core flows in low-fidelity
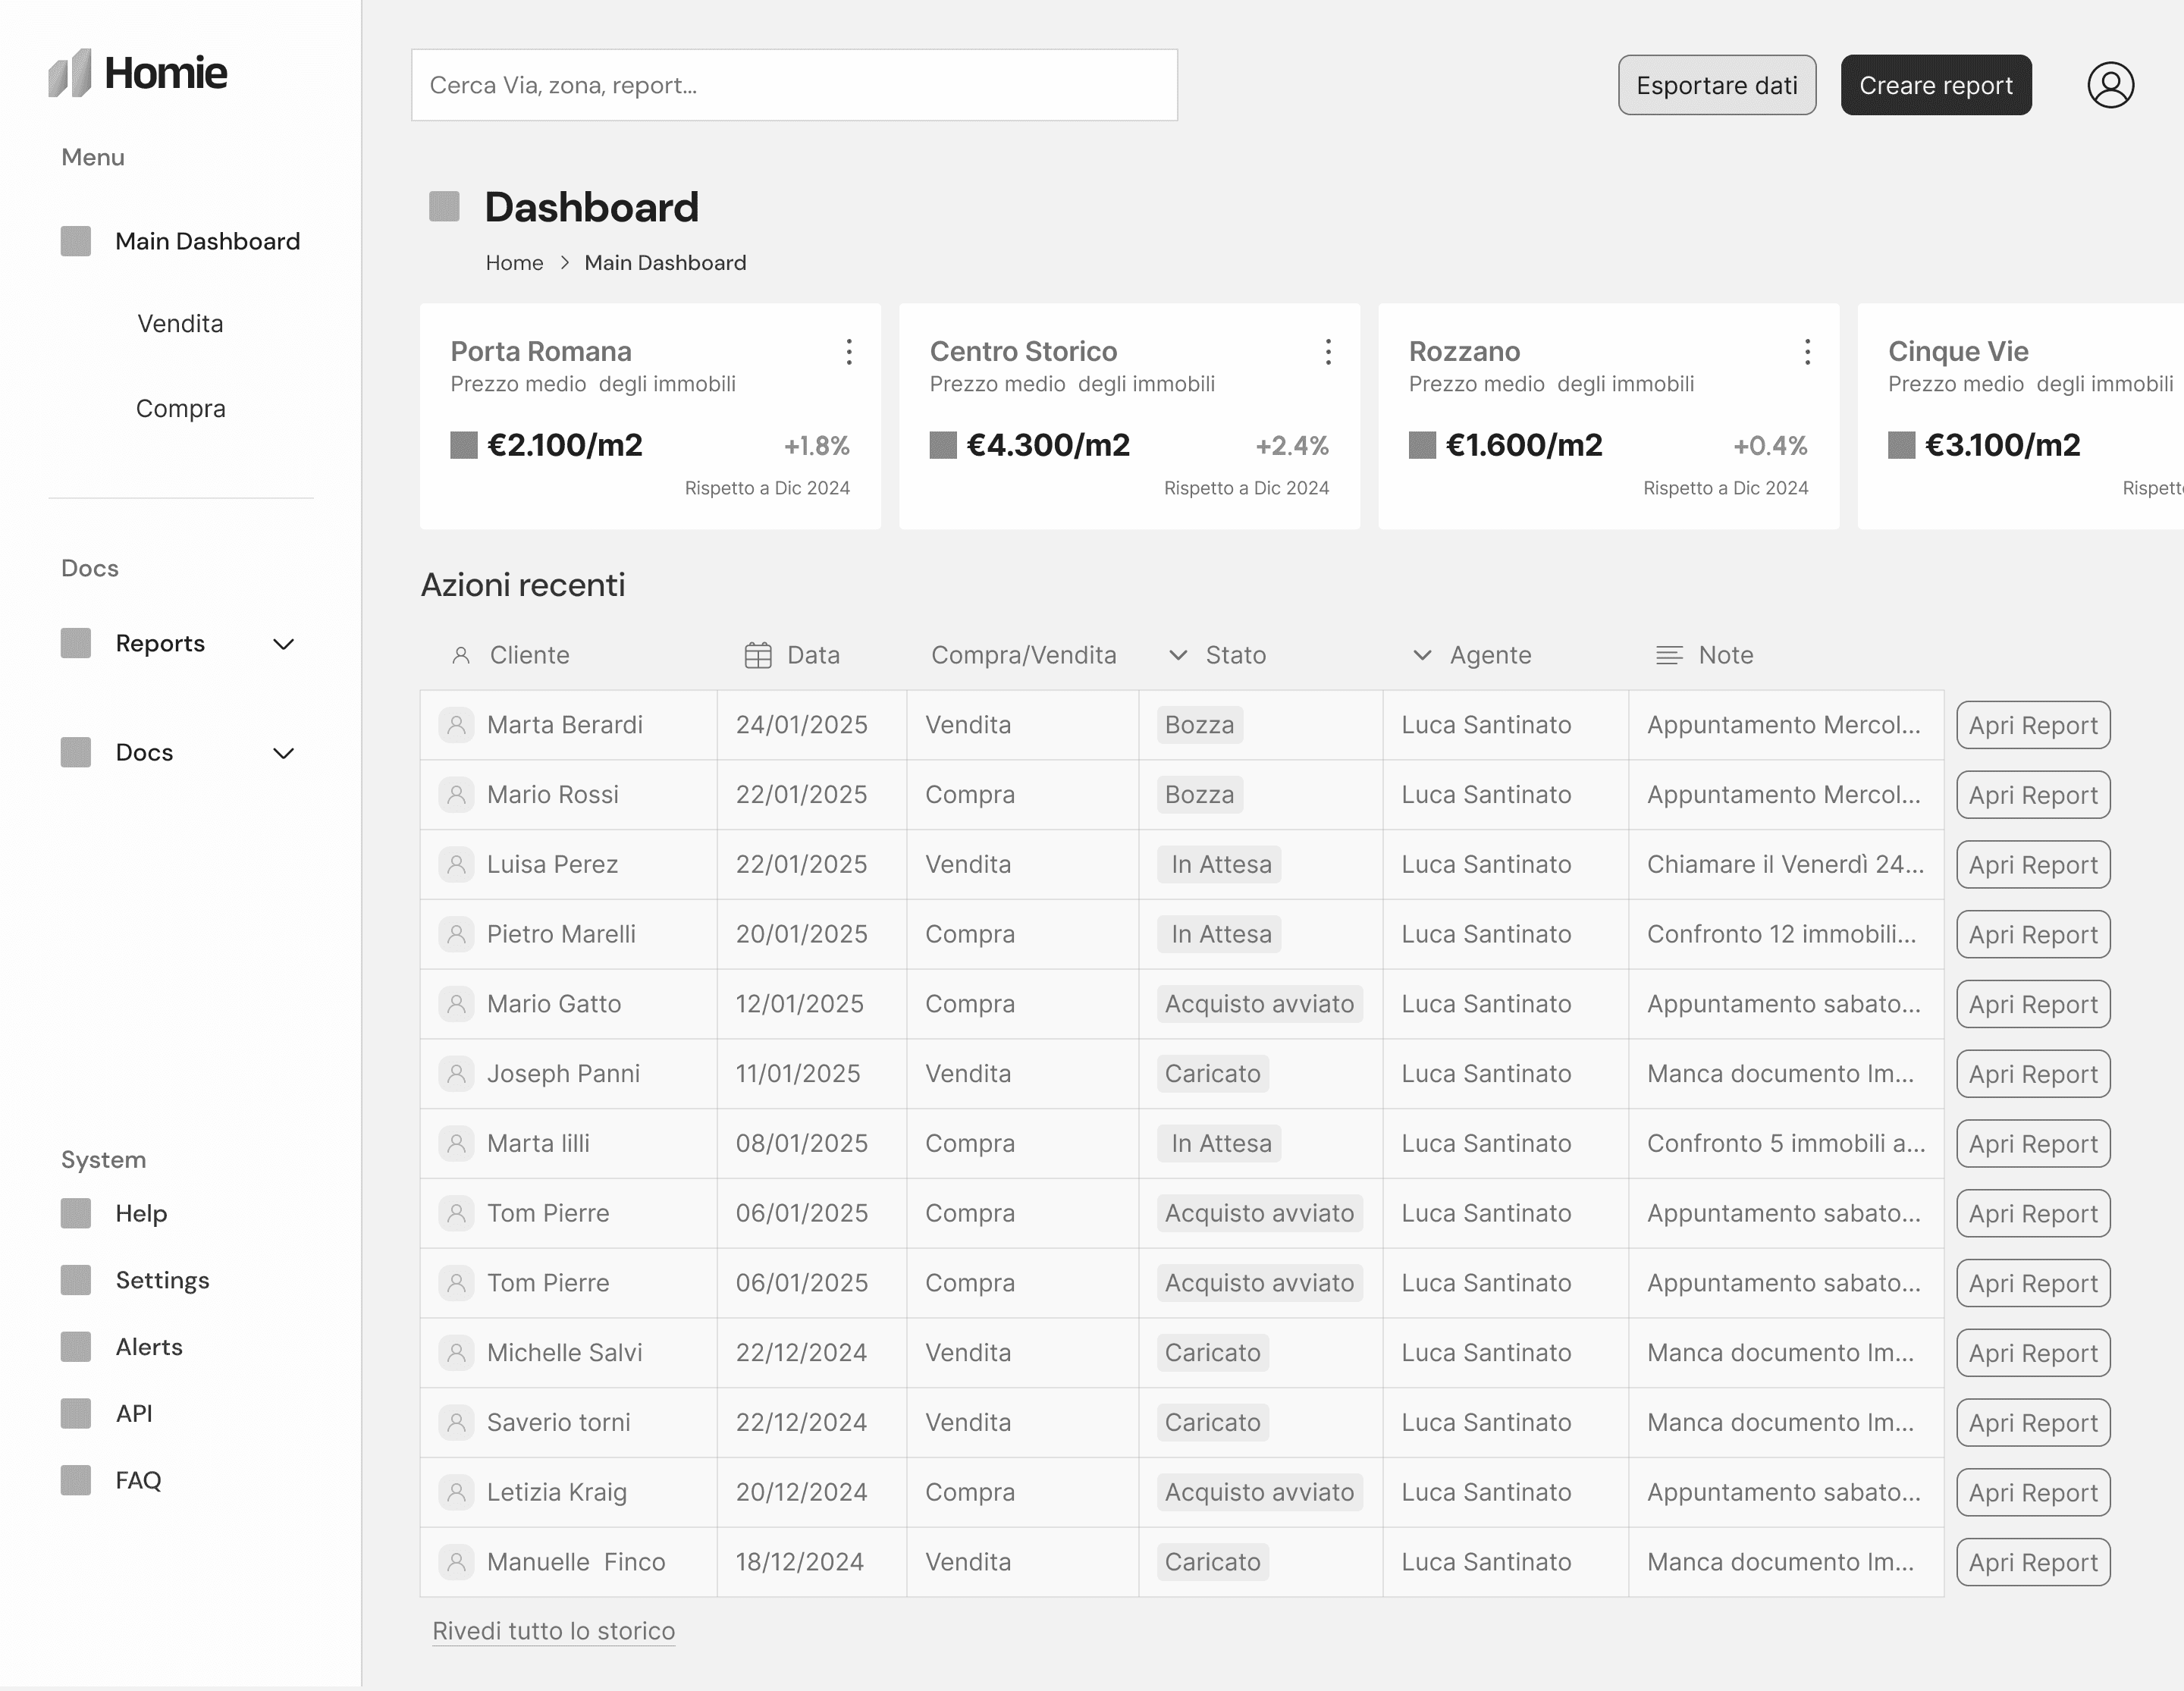
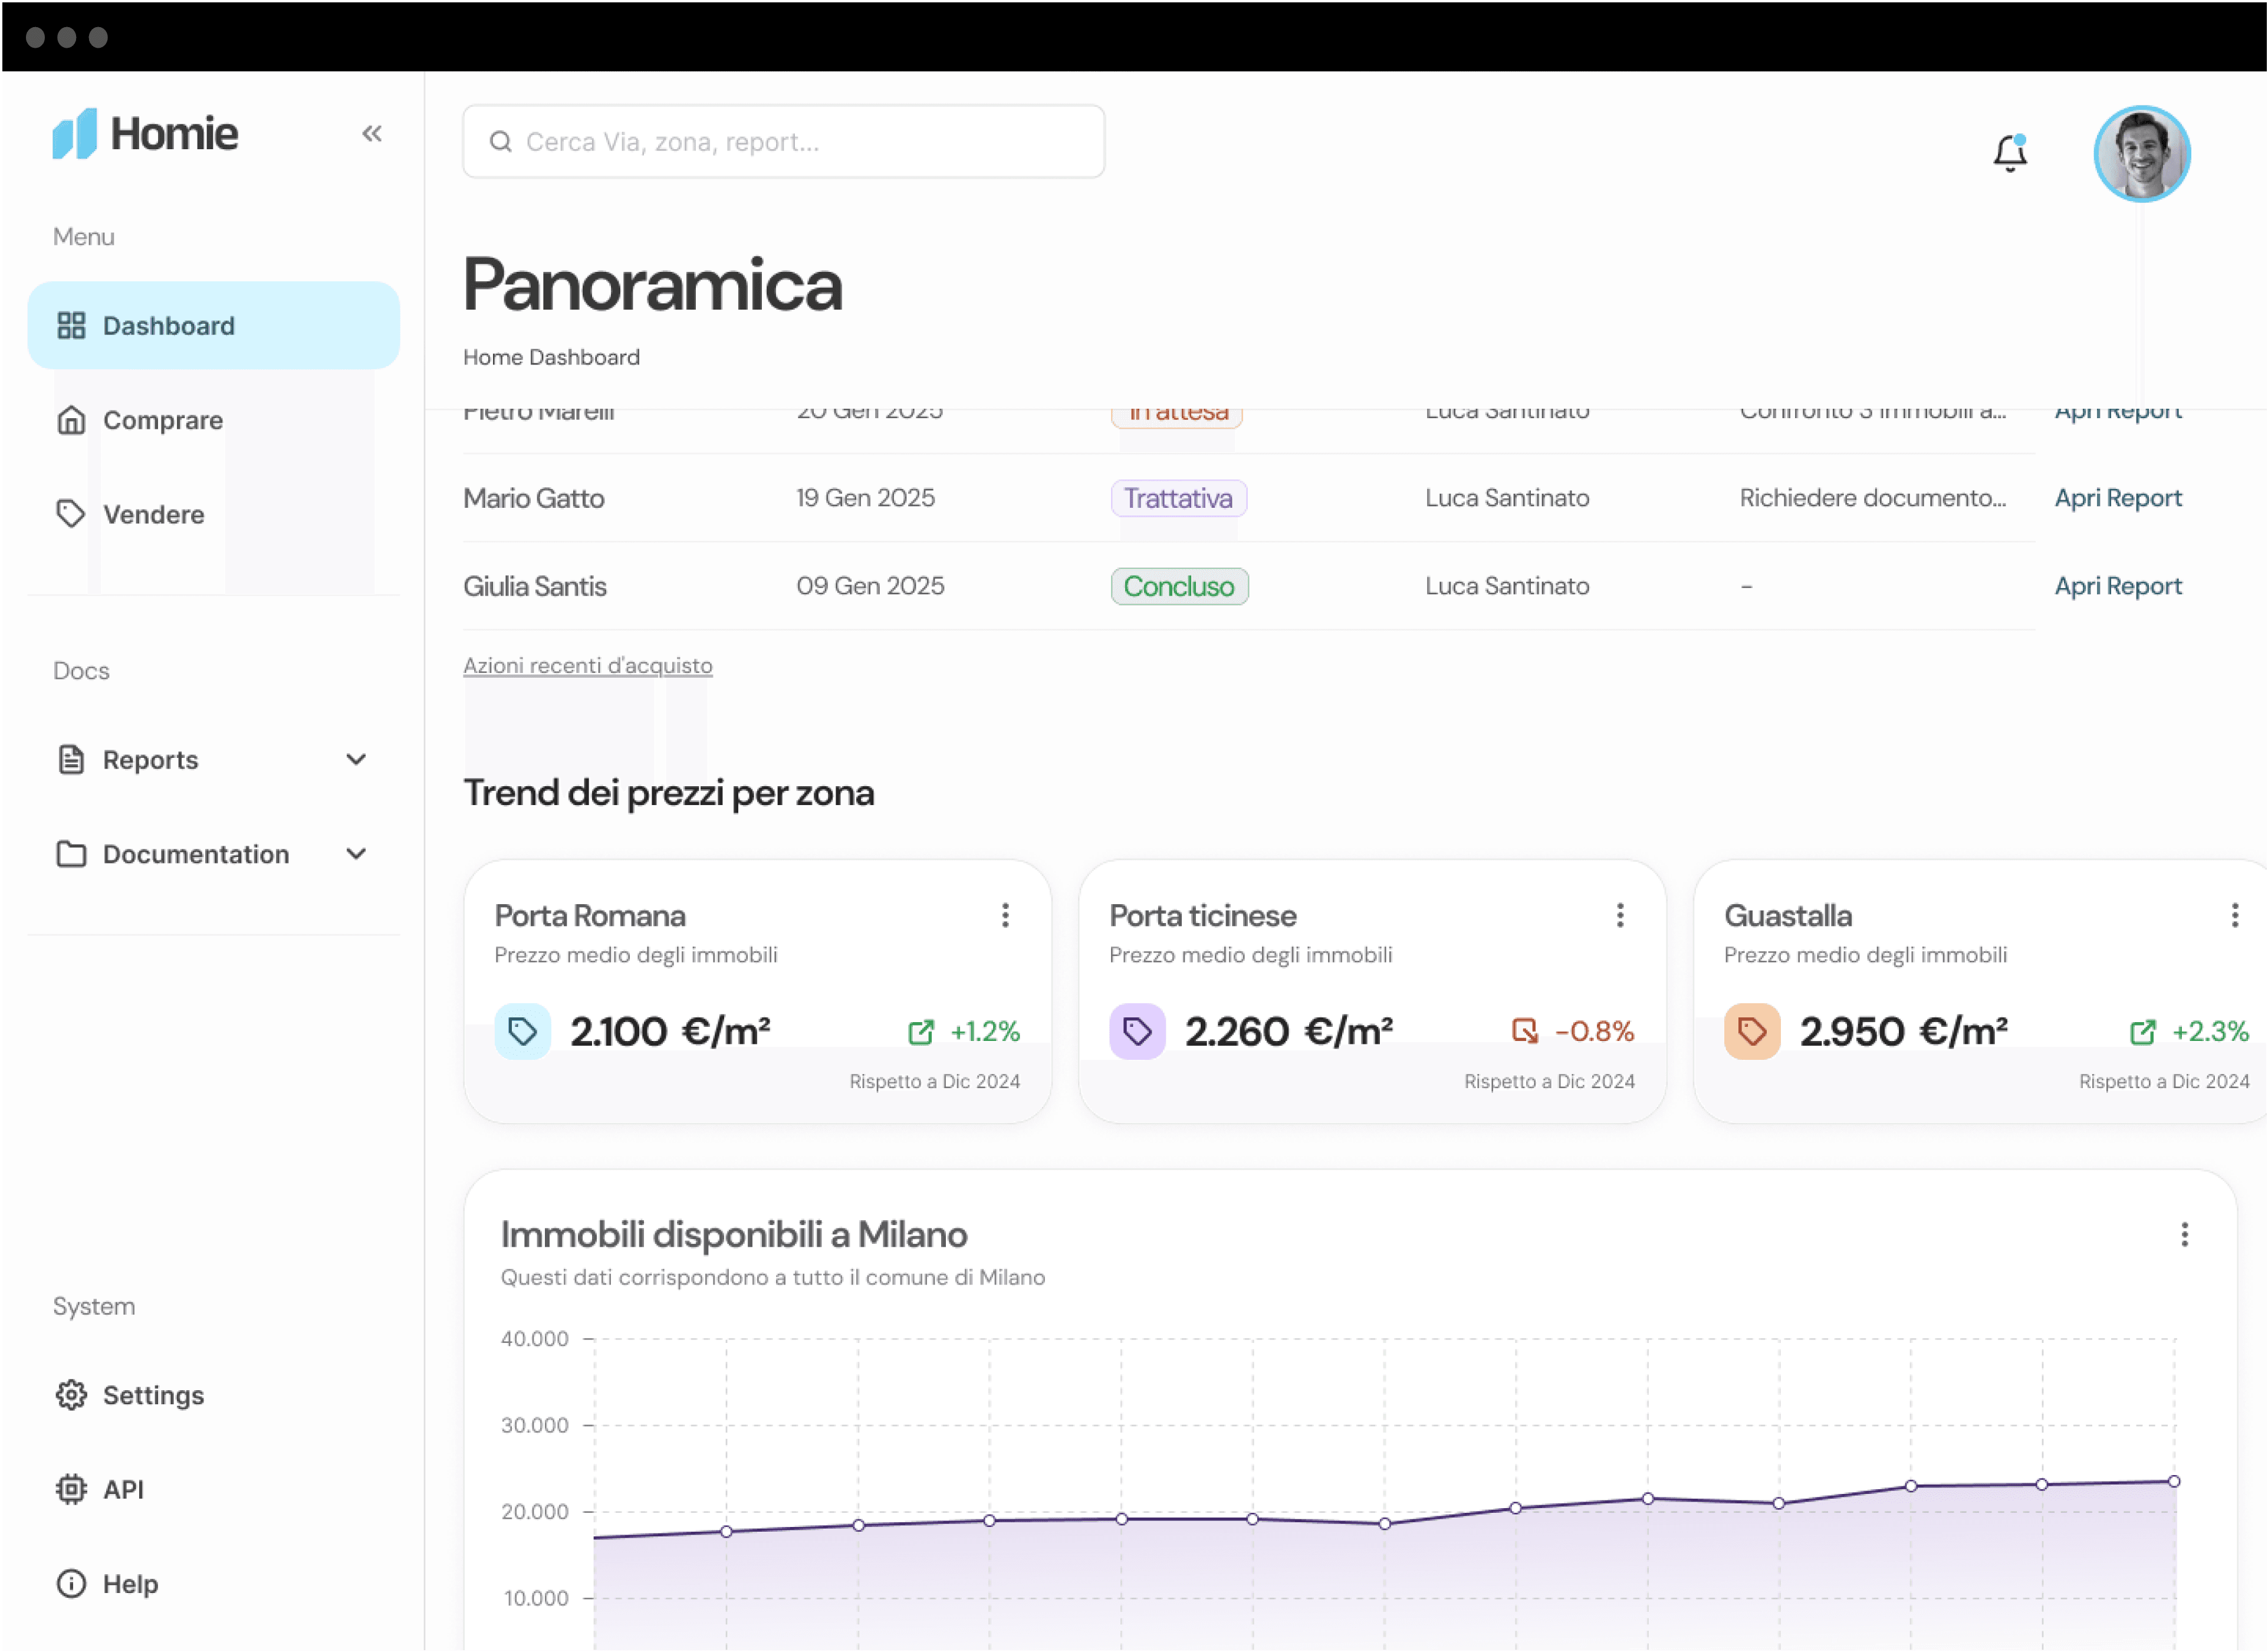
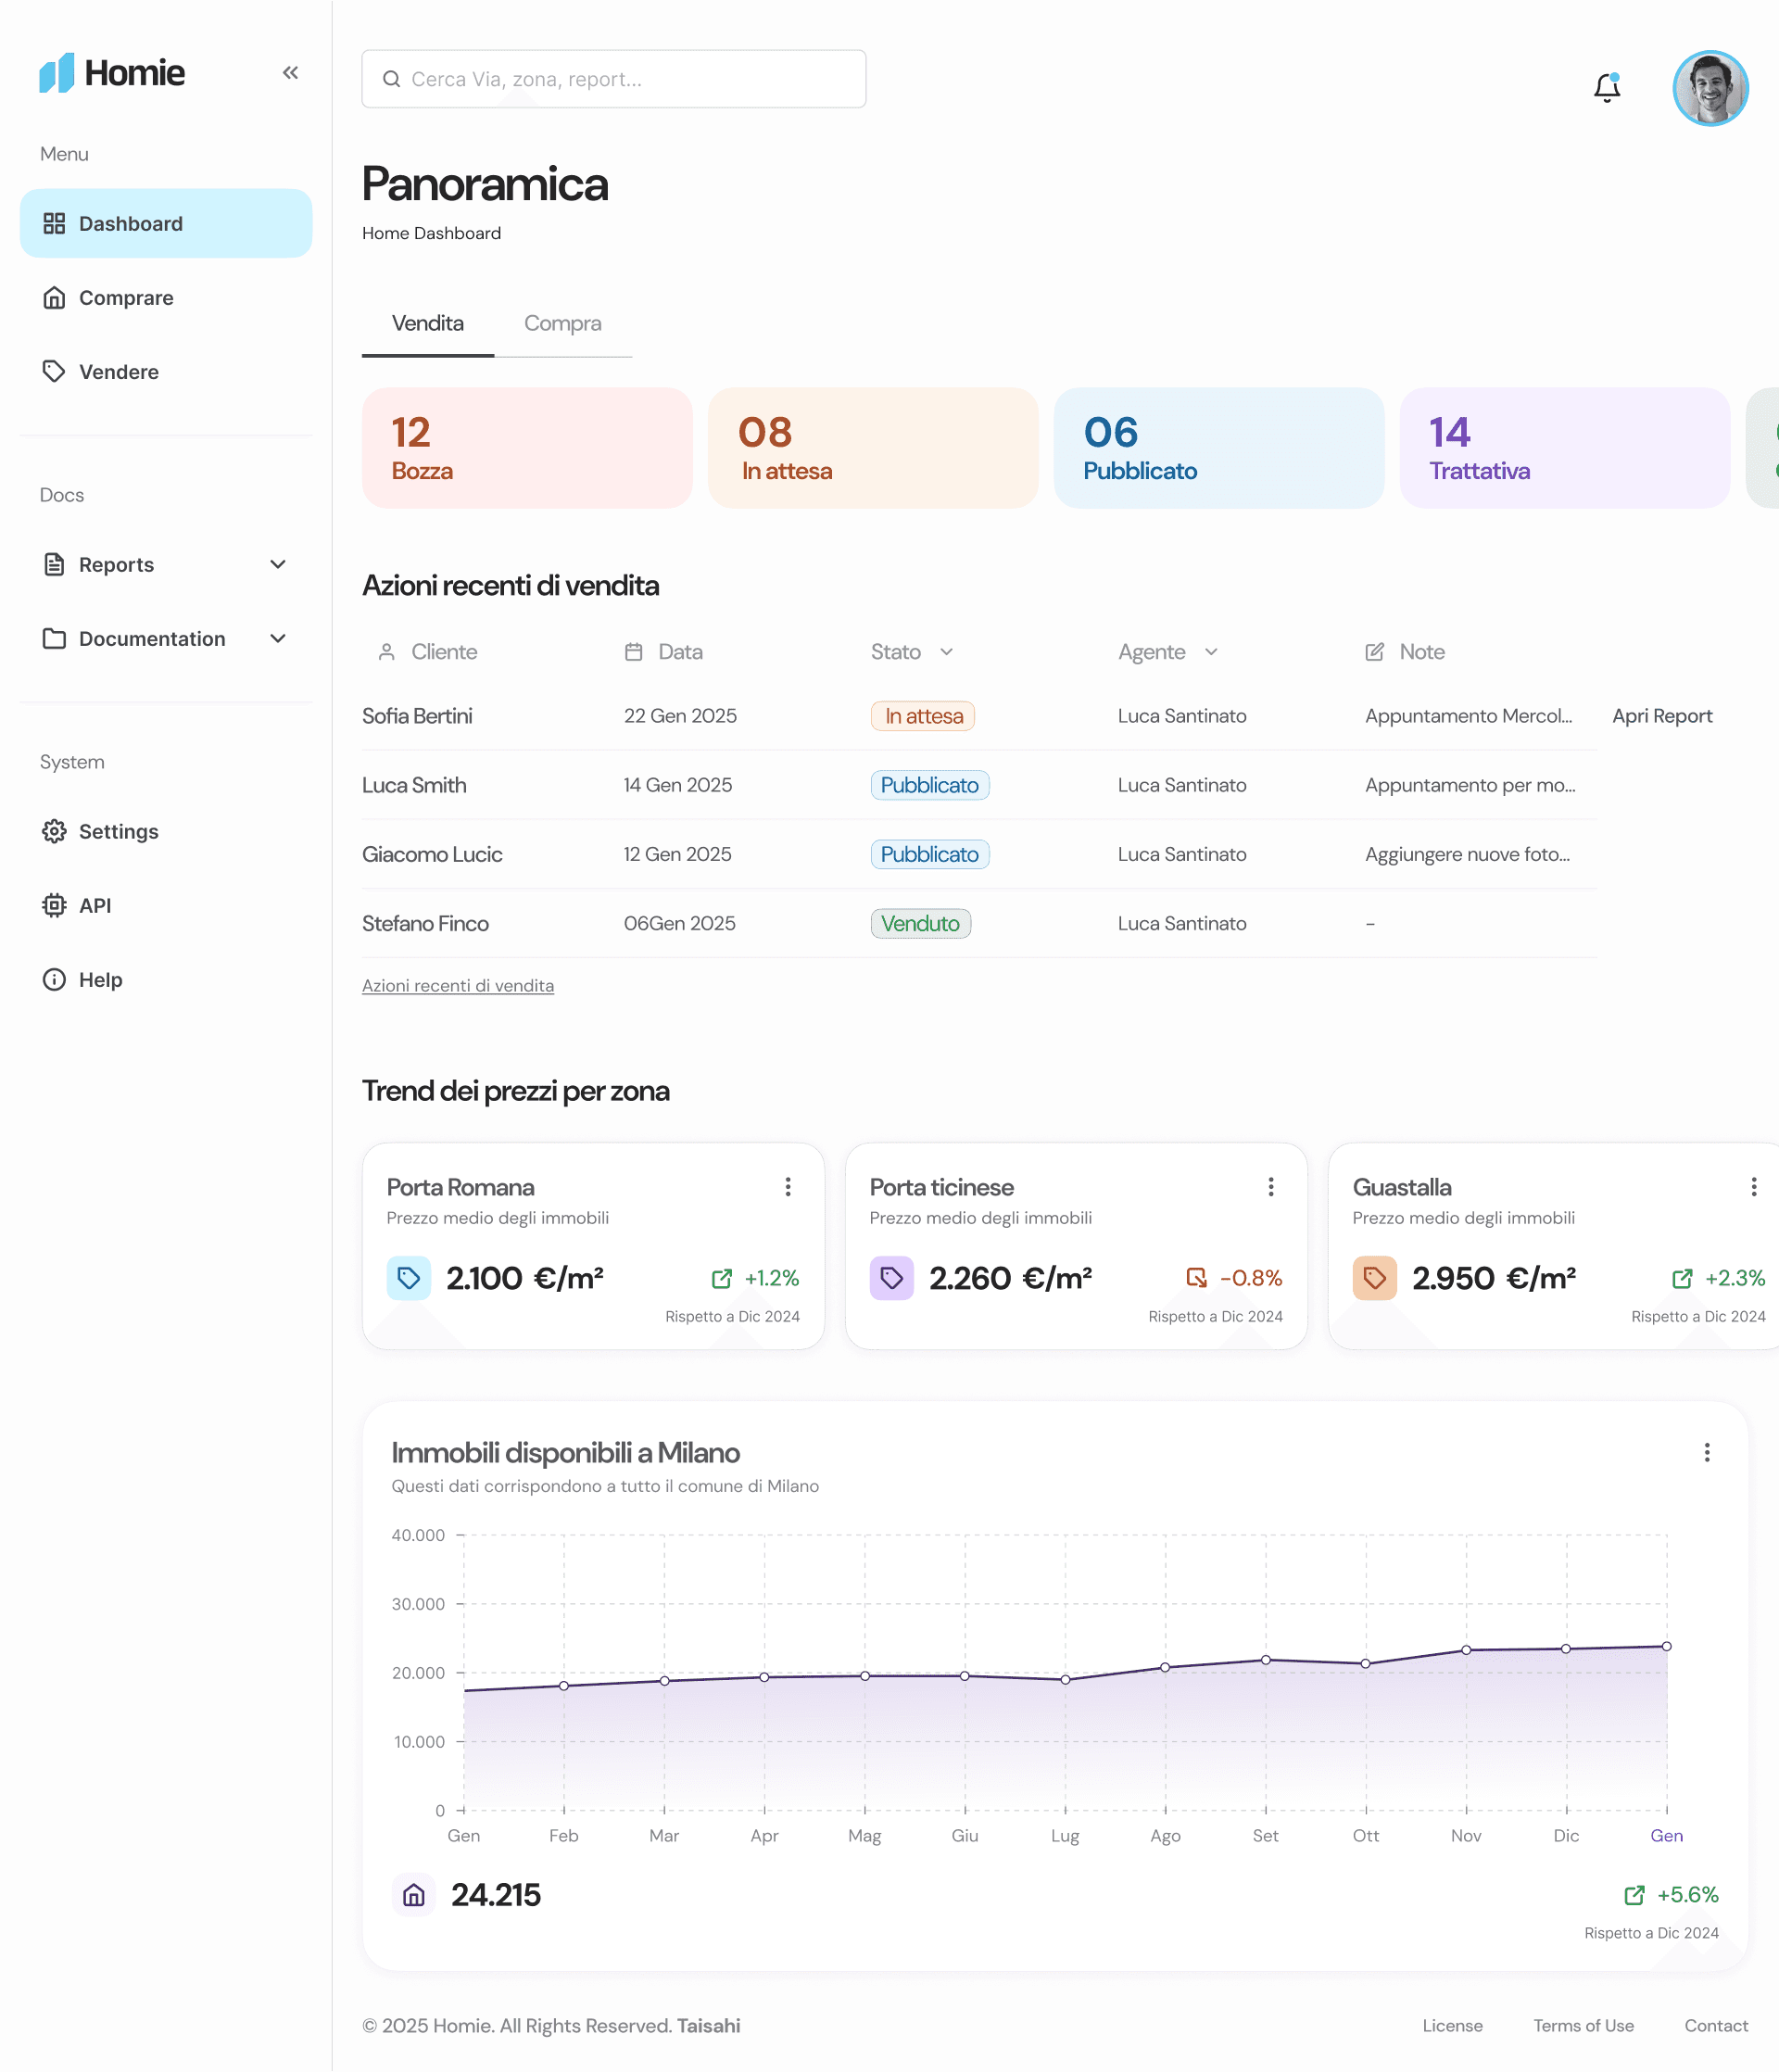
I wanted to get the design in front of users quickly to see where the flow could be smoothed out.

I wanted to get the design in front of users quickly to see where the flow could be smoothed out.

Core UIs

Home dashboard UI
Home dashboard UI
Home dashboard UI

Home Dashboard

When agents open Homie, they land on this UI. It shows recent buy/sell activities and price trends in their managed areas. From here, they can start the process to sell a client’s home or help a client find one.
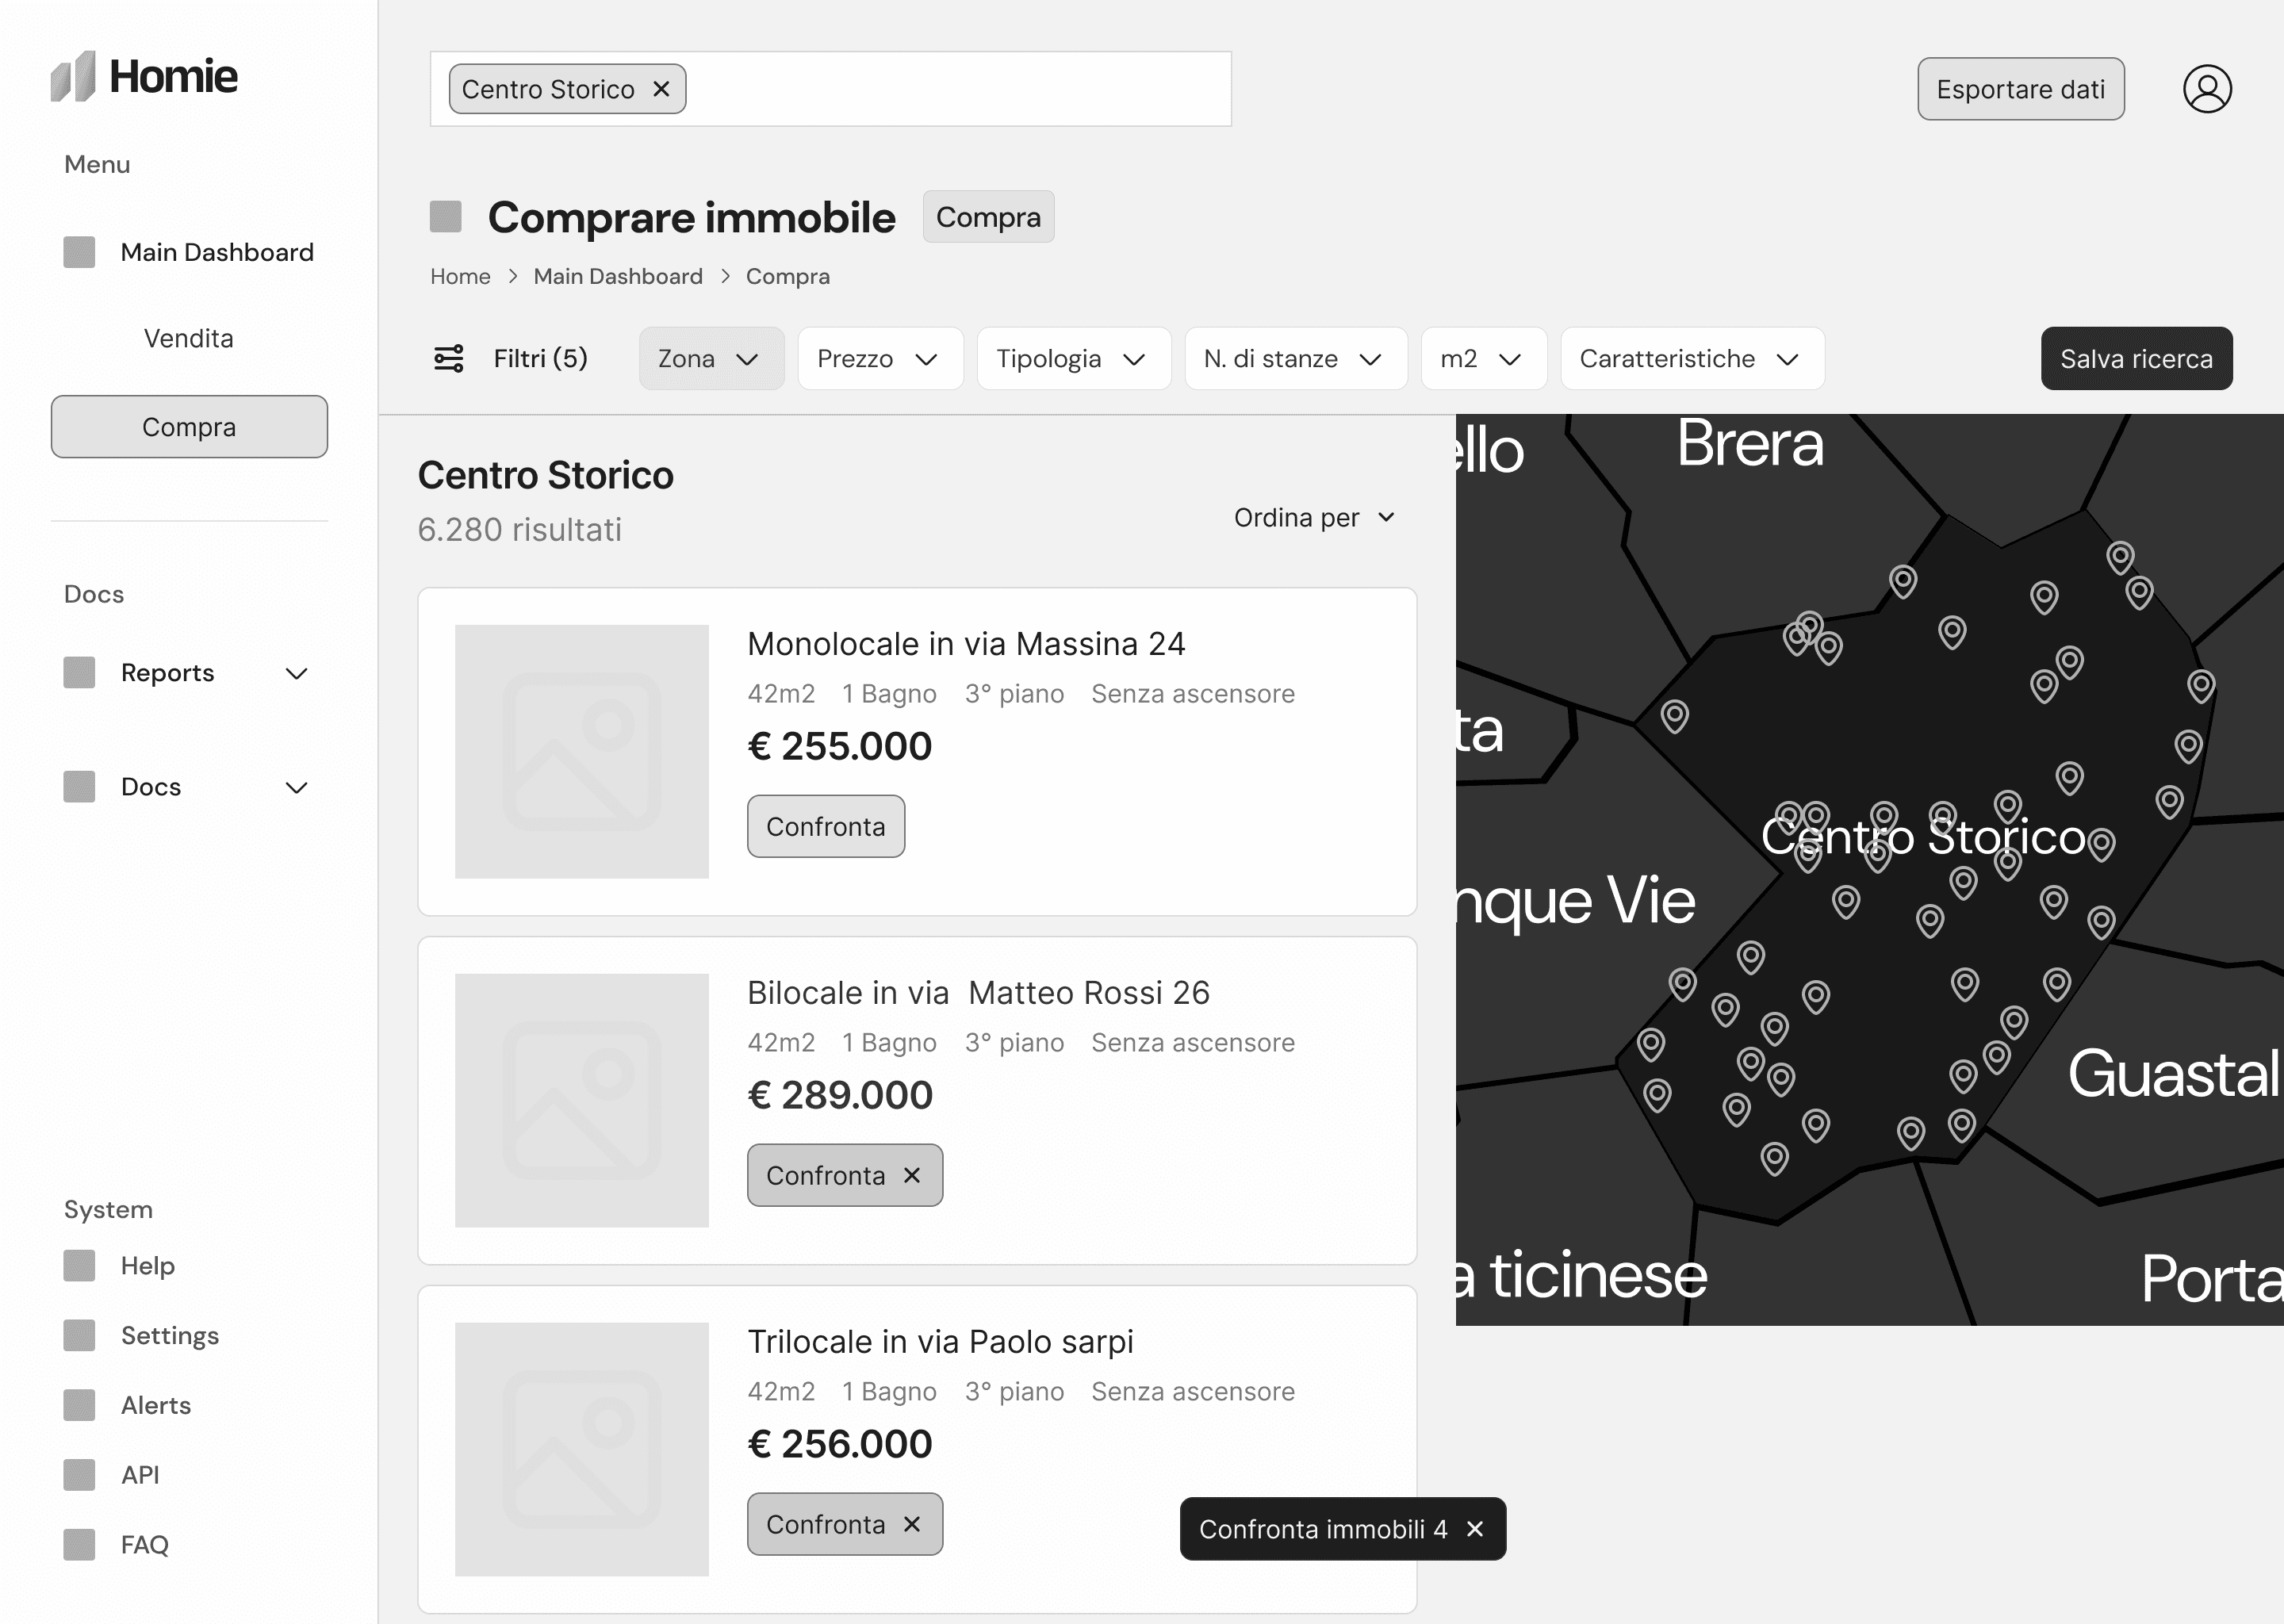
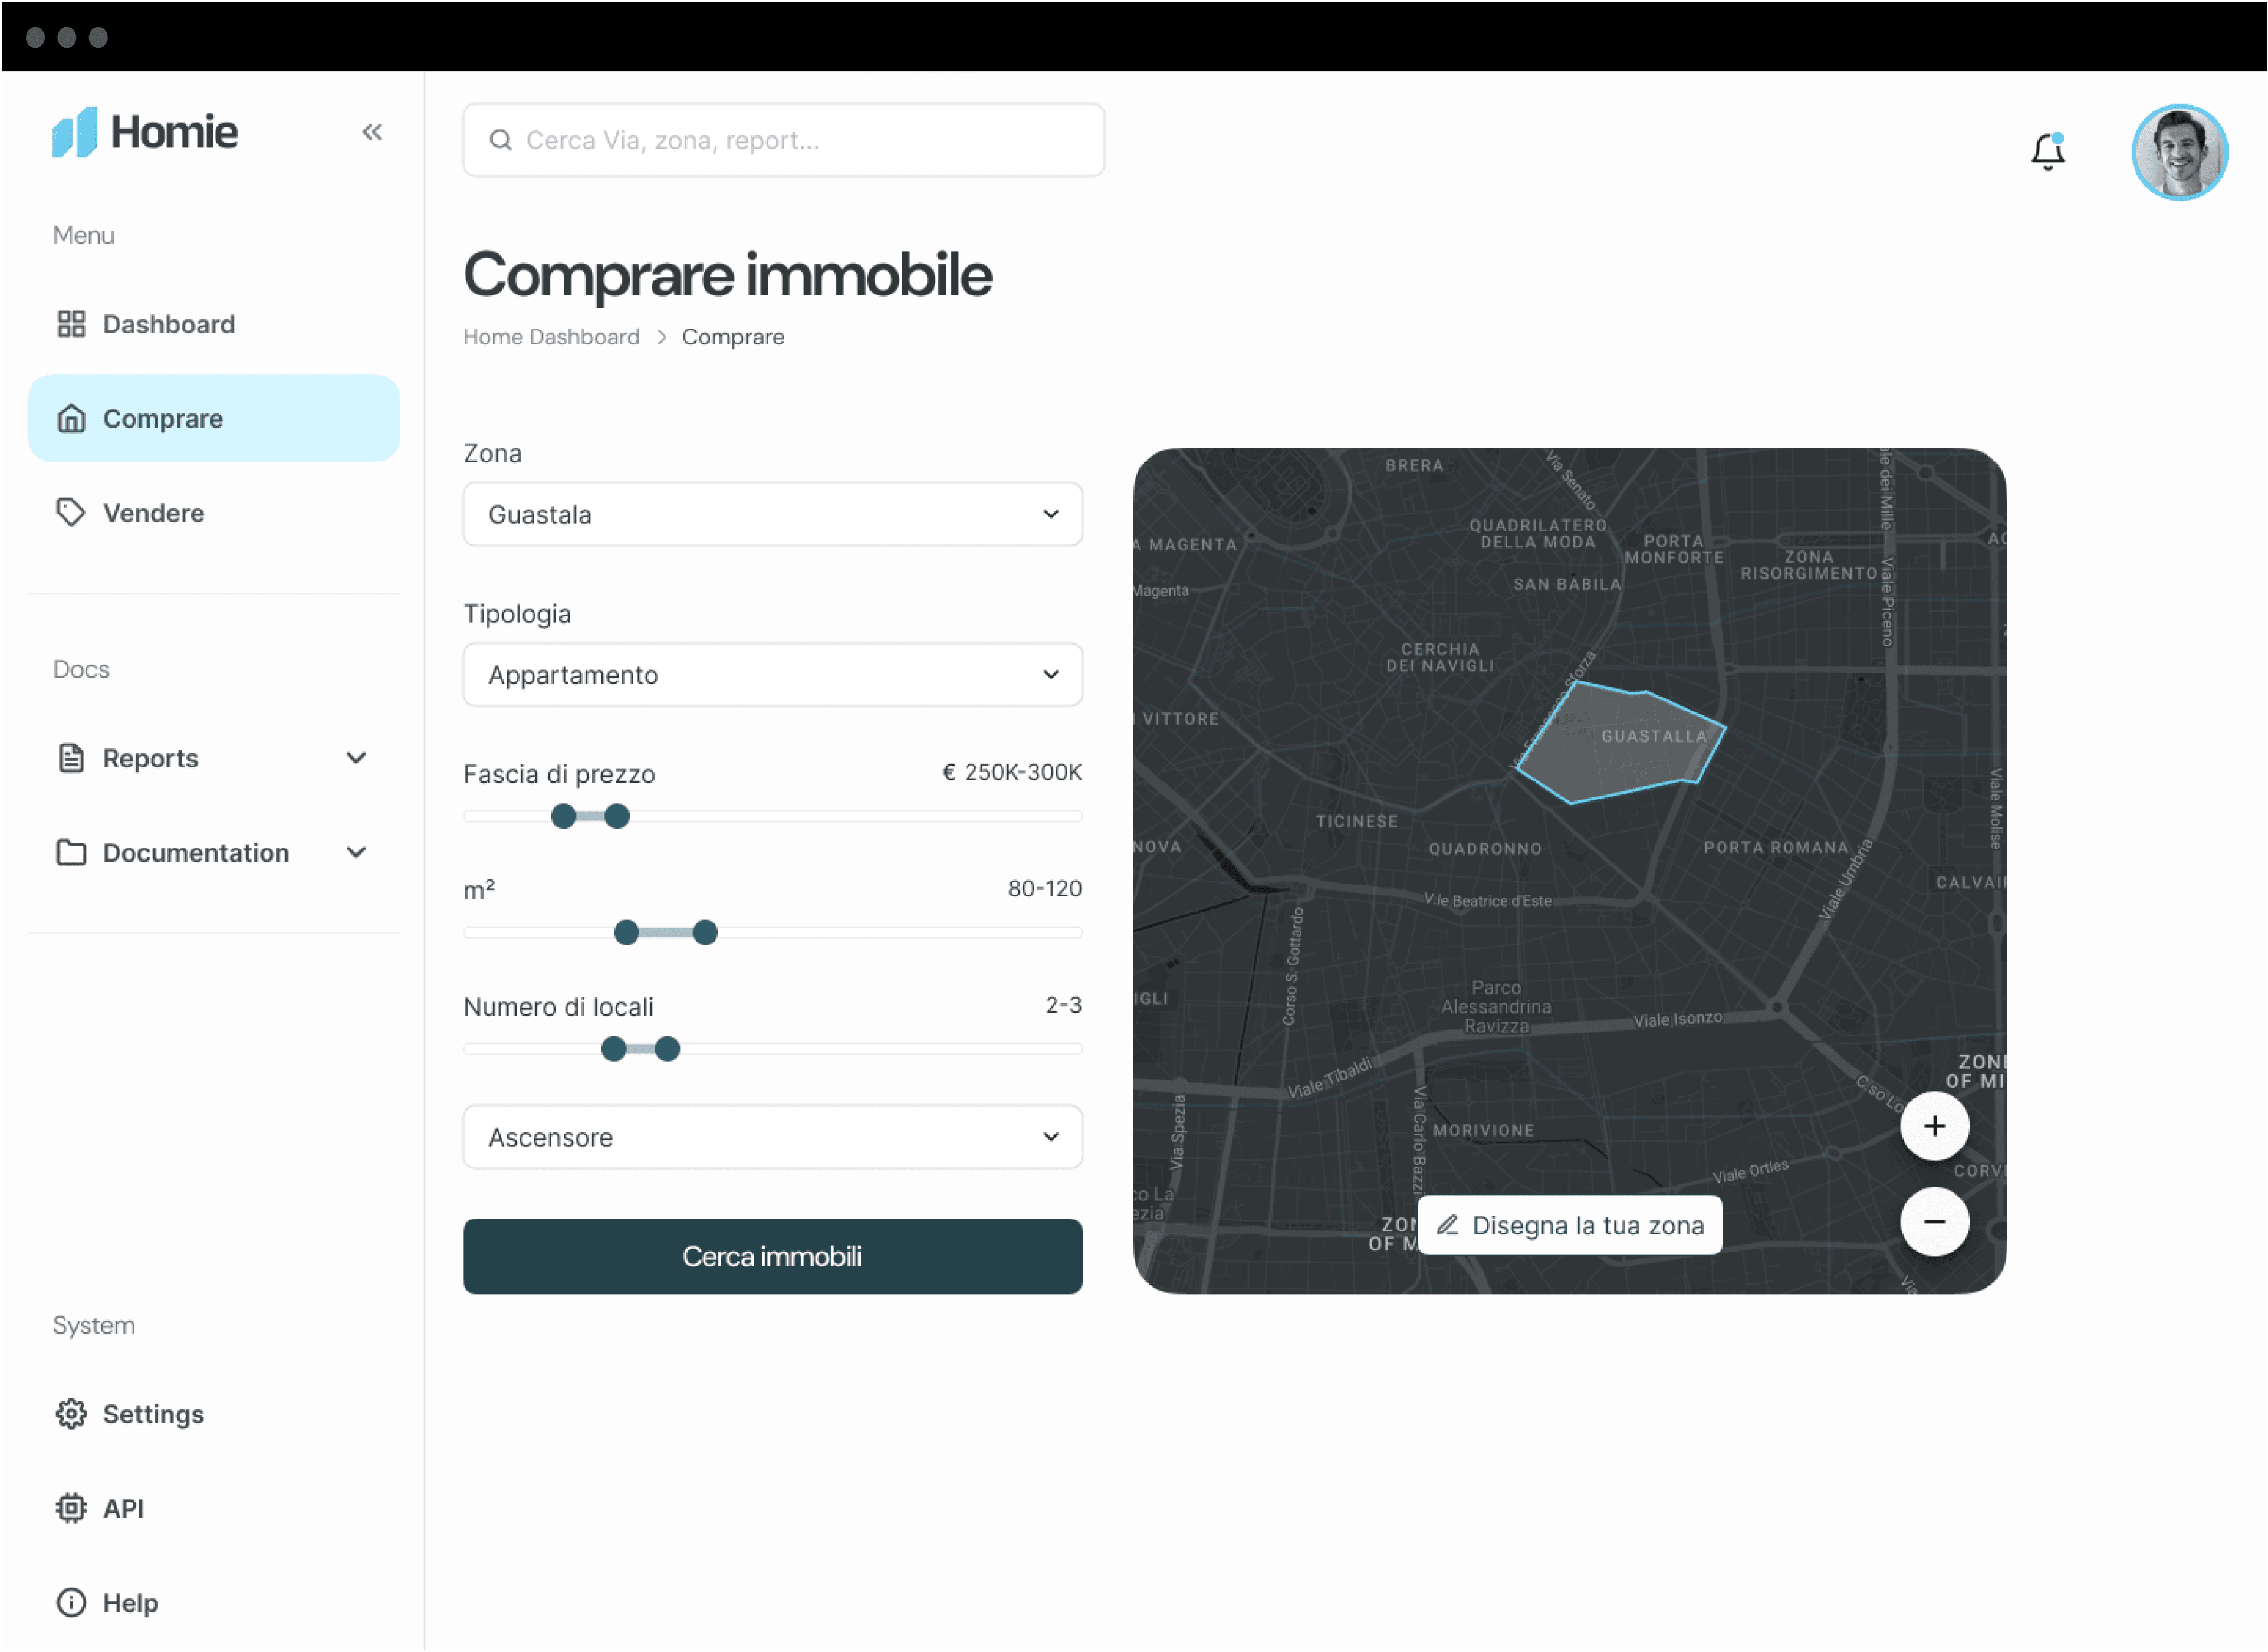
Property listing UI
Property listing UI
Property listing UI

Property Listing

This UI works like any other property listing platform but with an added feature: agents can select properties to compare.
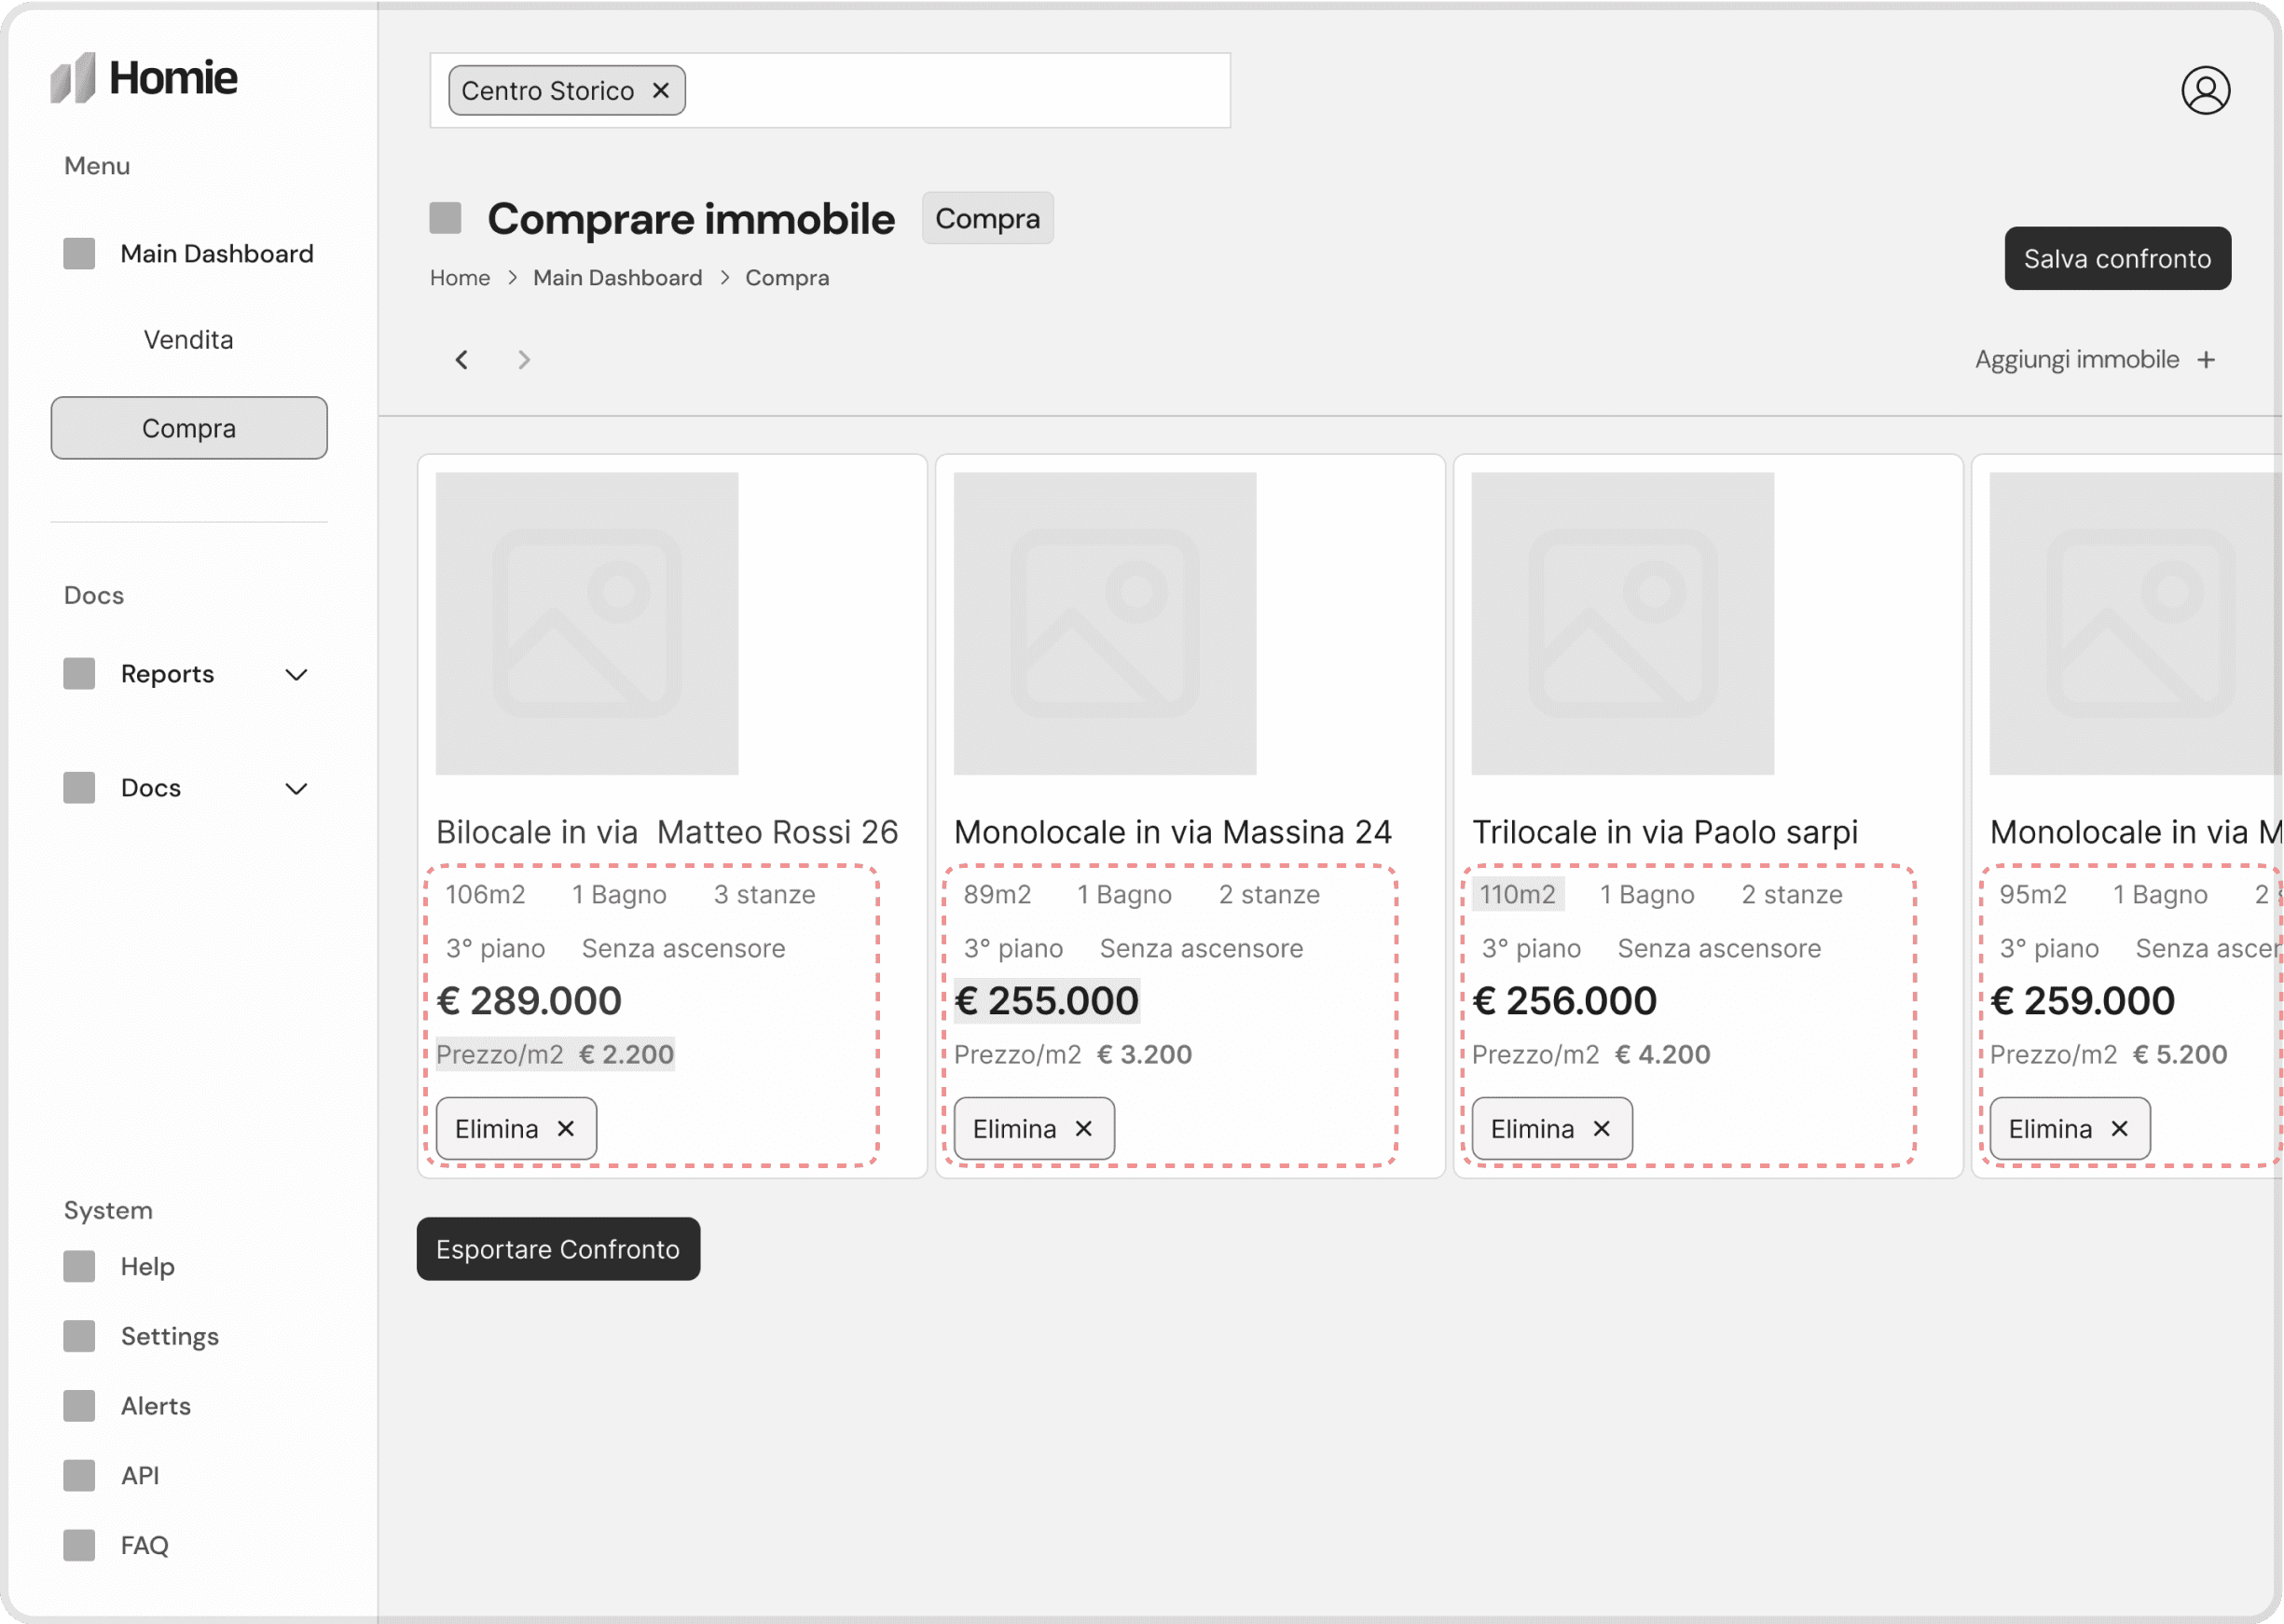
property comparison UI

Property comparison

Here, agents and clients can compare selected properties side by side. Key details like price, size, and price per square meter are displayed in a clean, organized way. Plus, standout values, like the lowest price, largest size, or best price per square meter.

Property sales projection UI

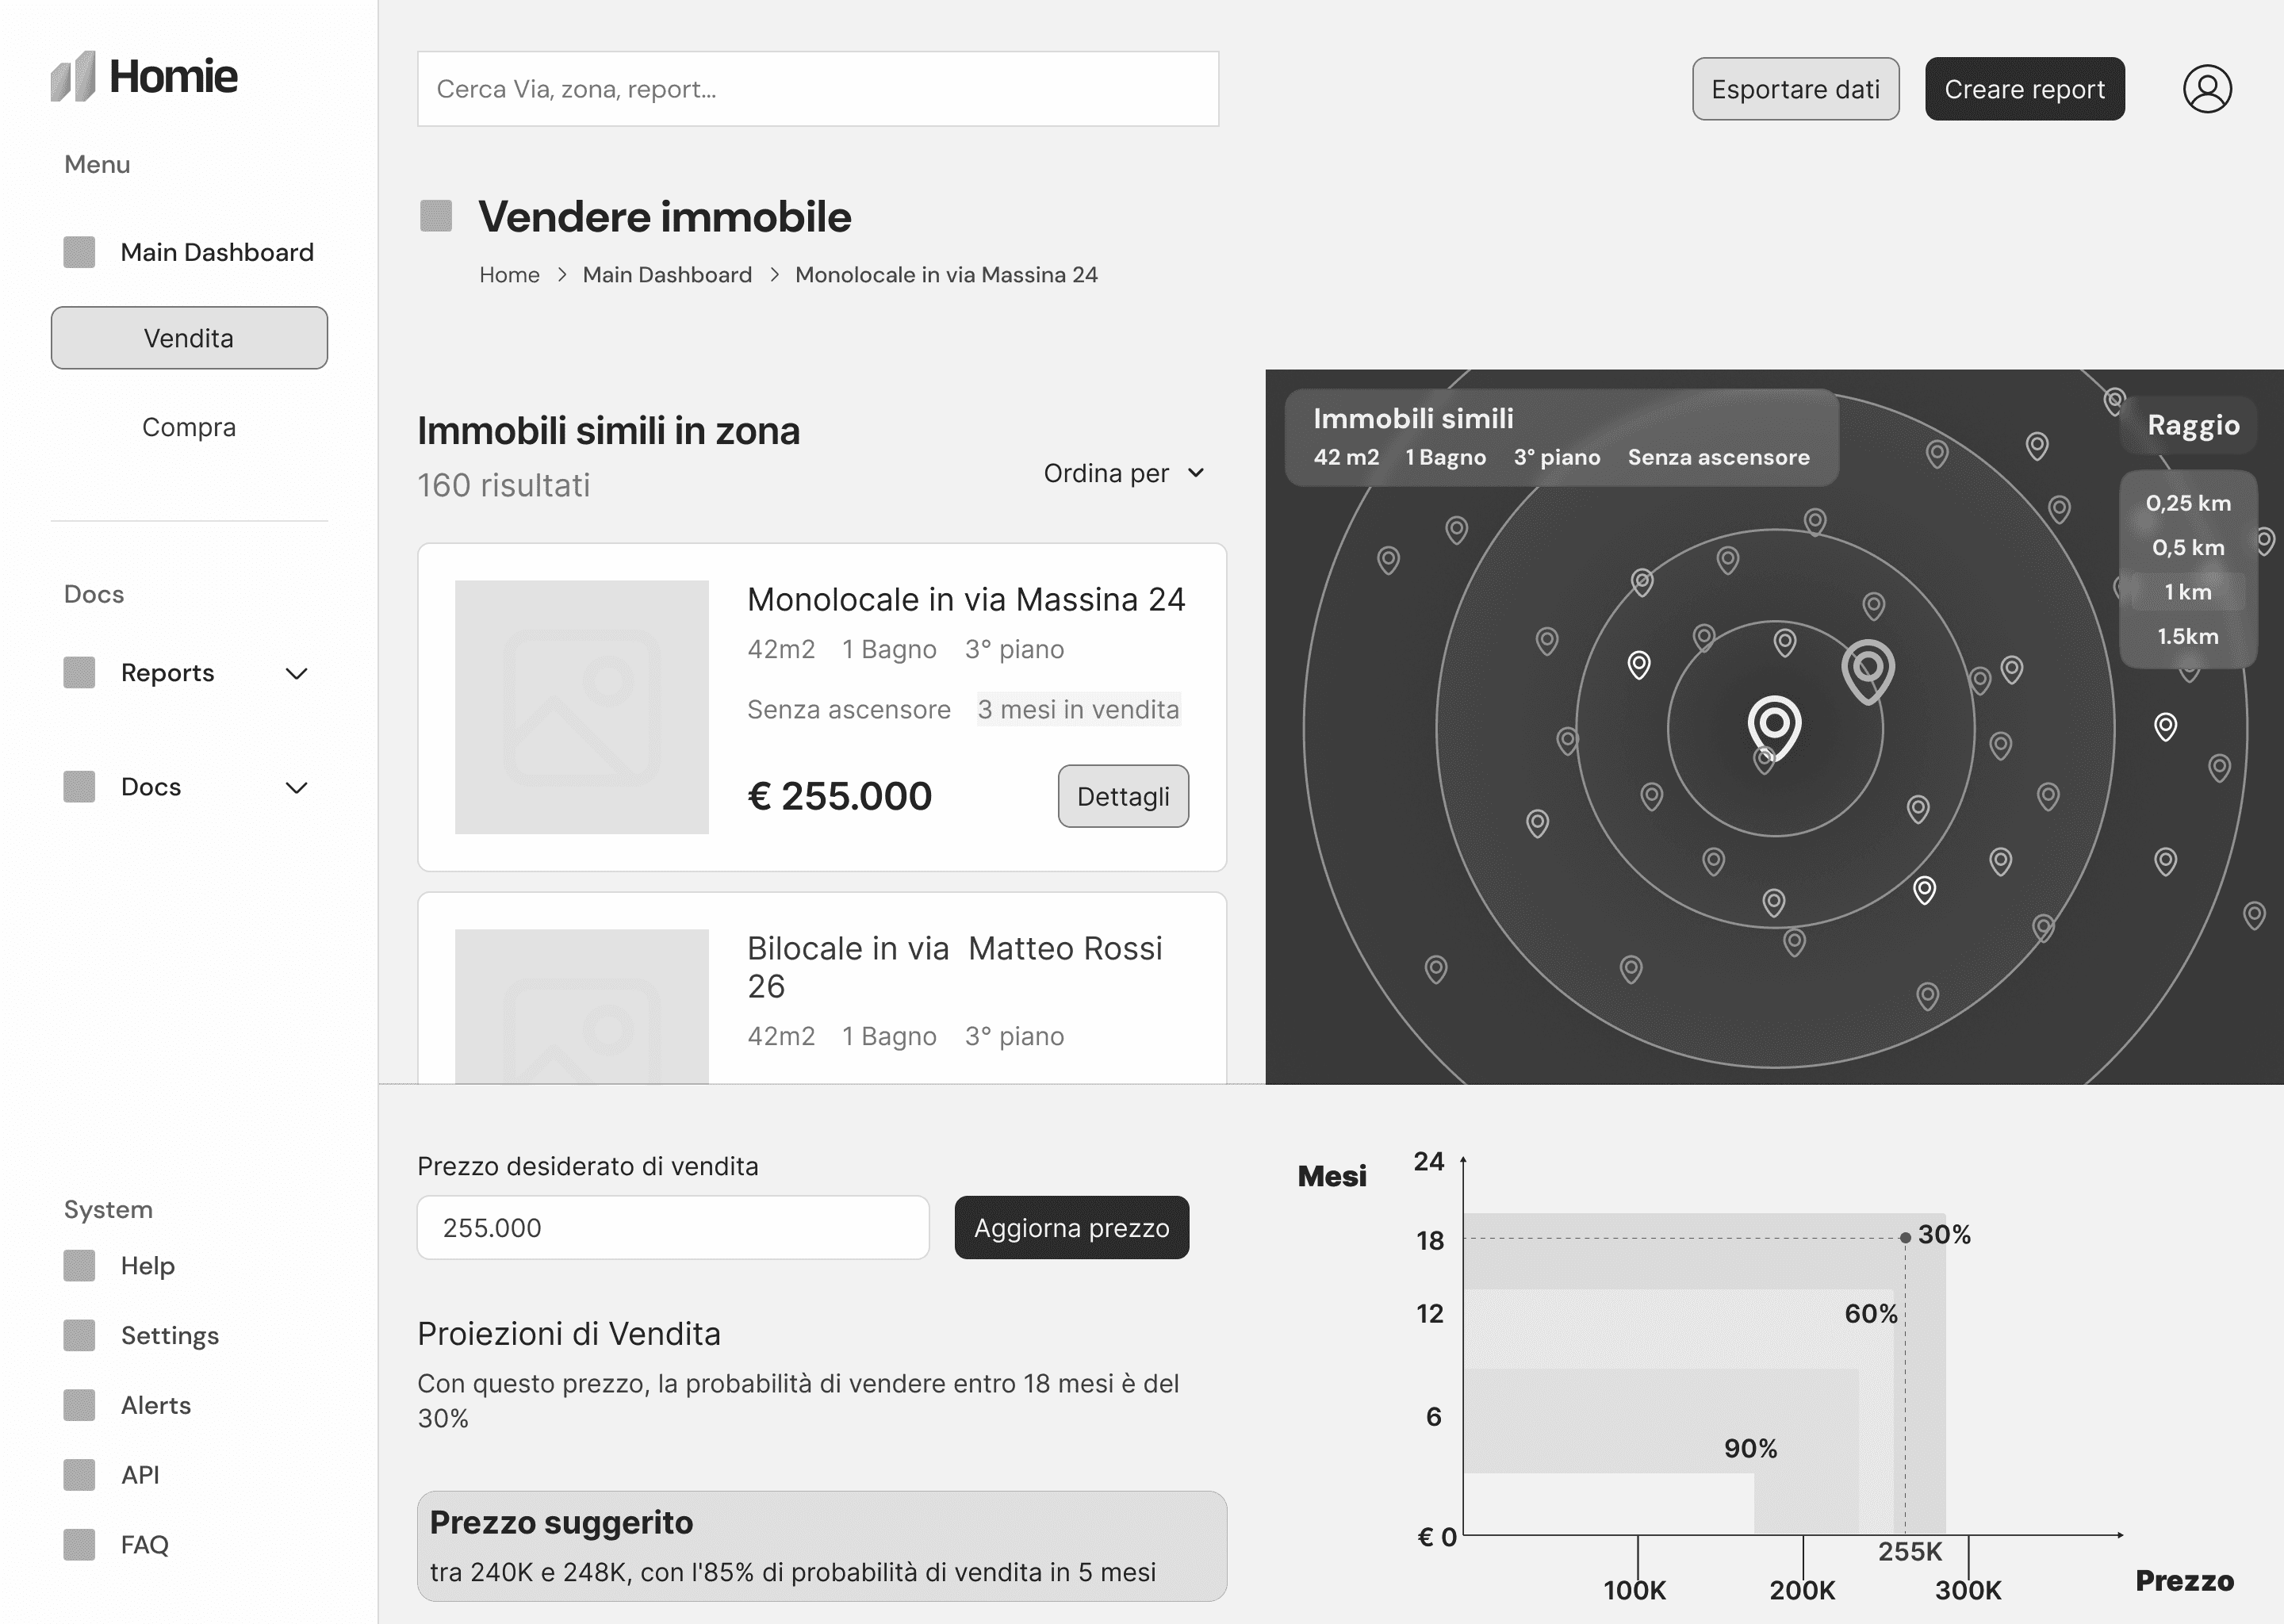
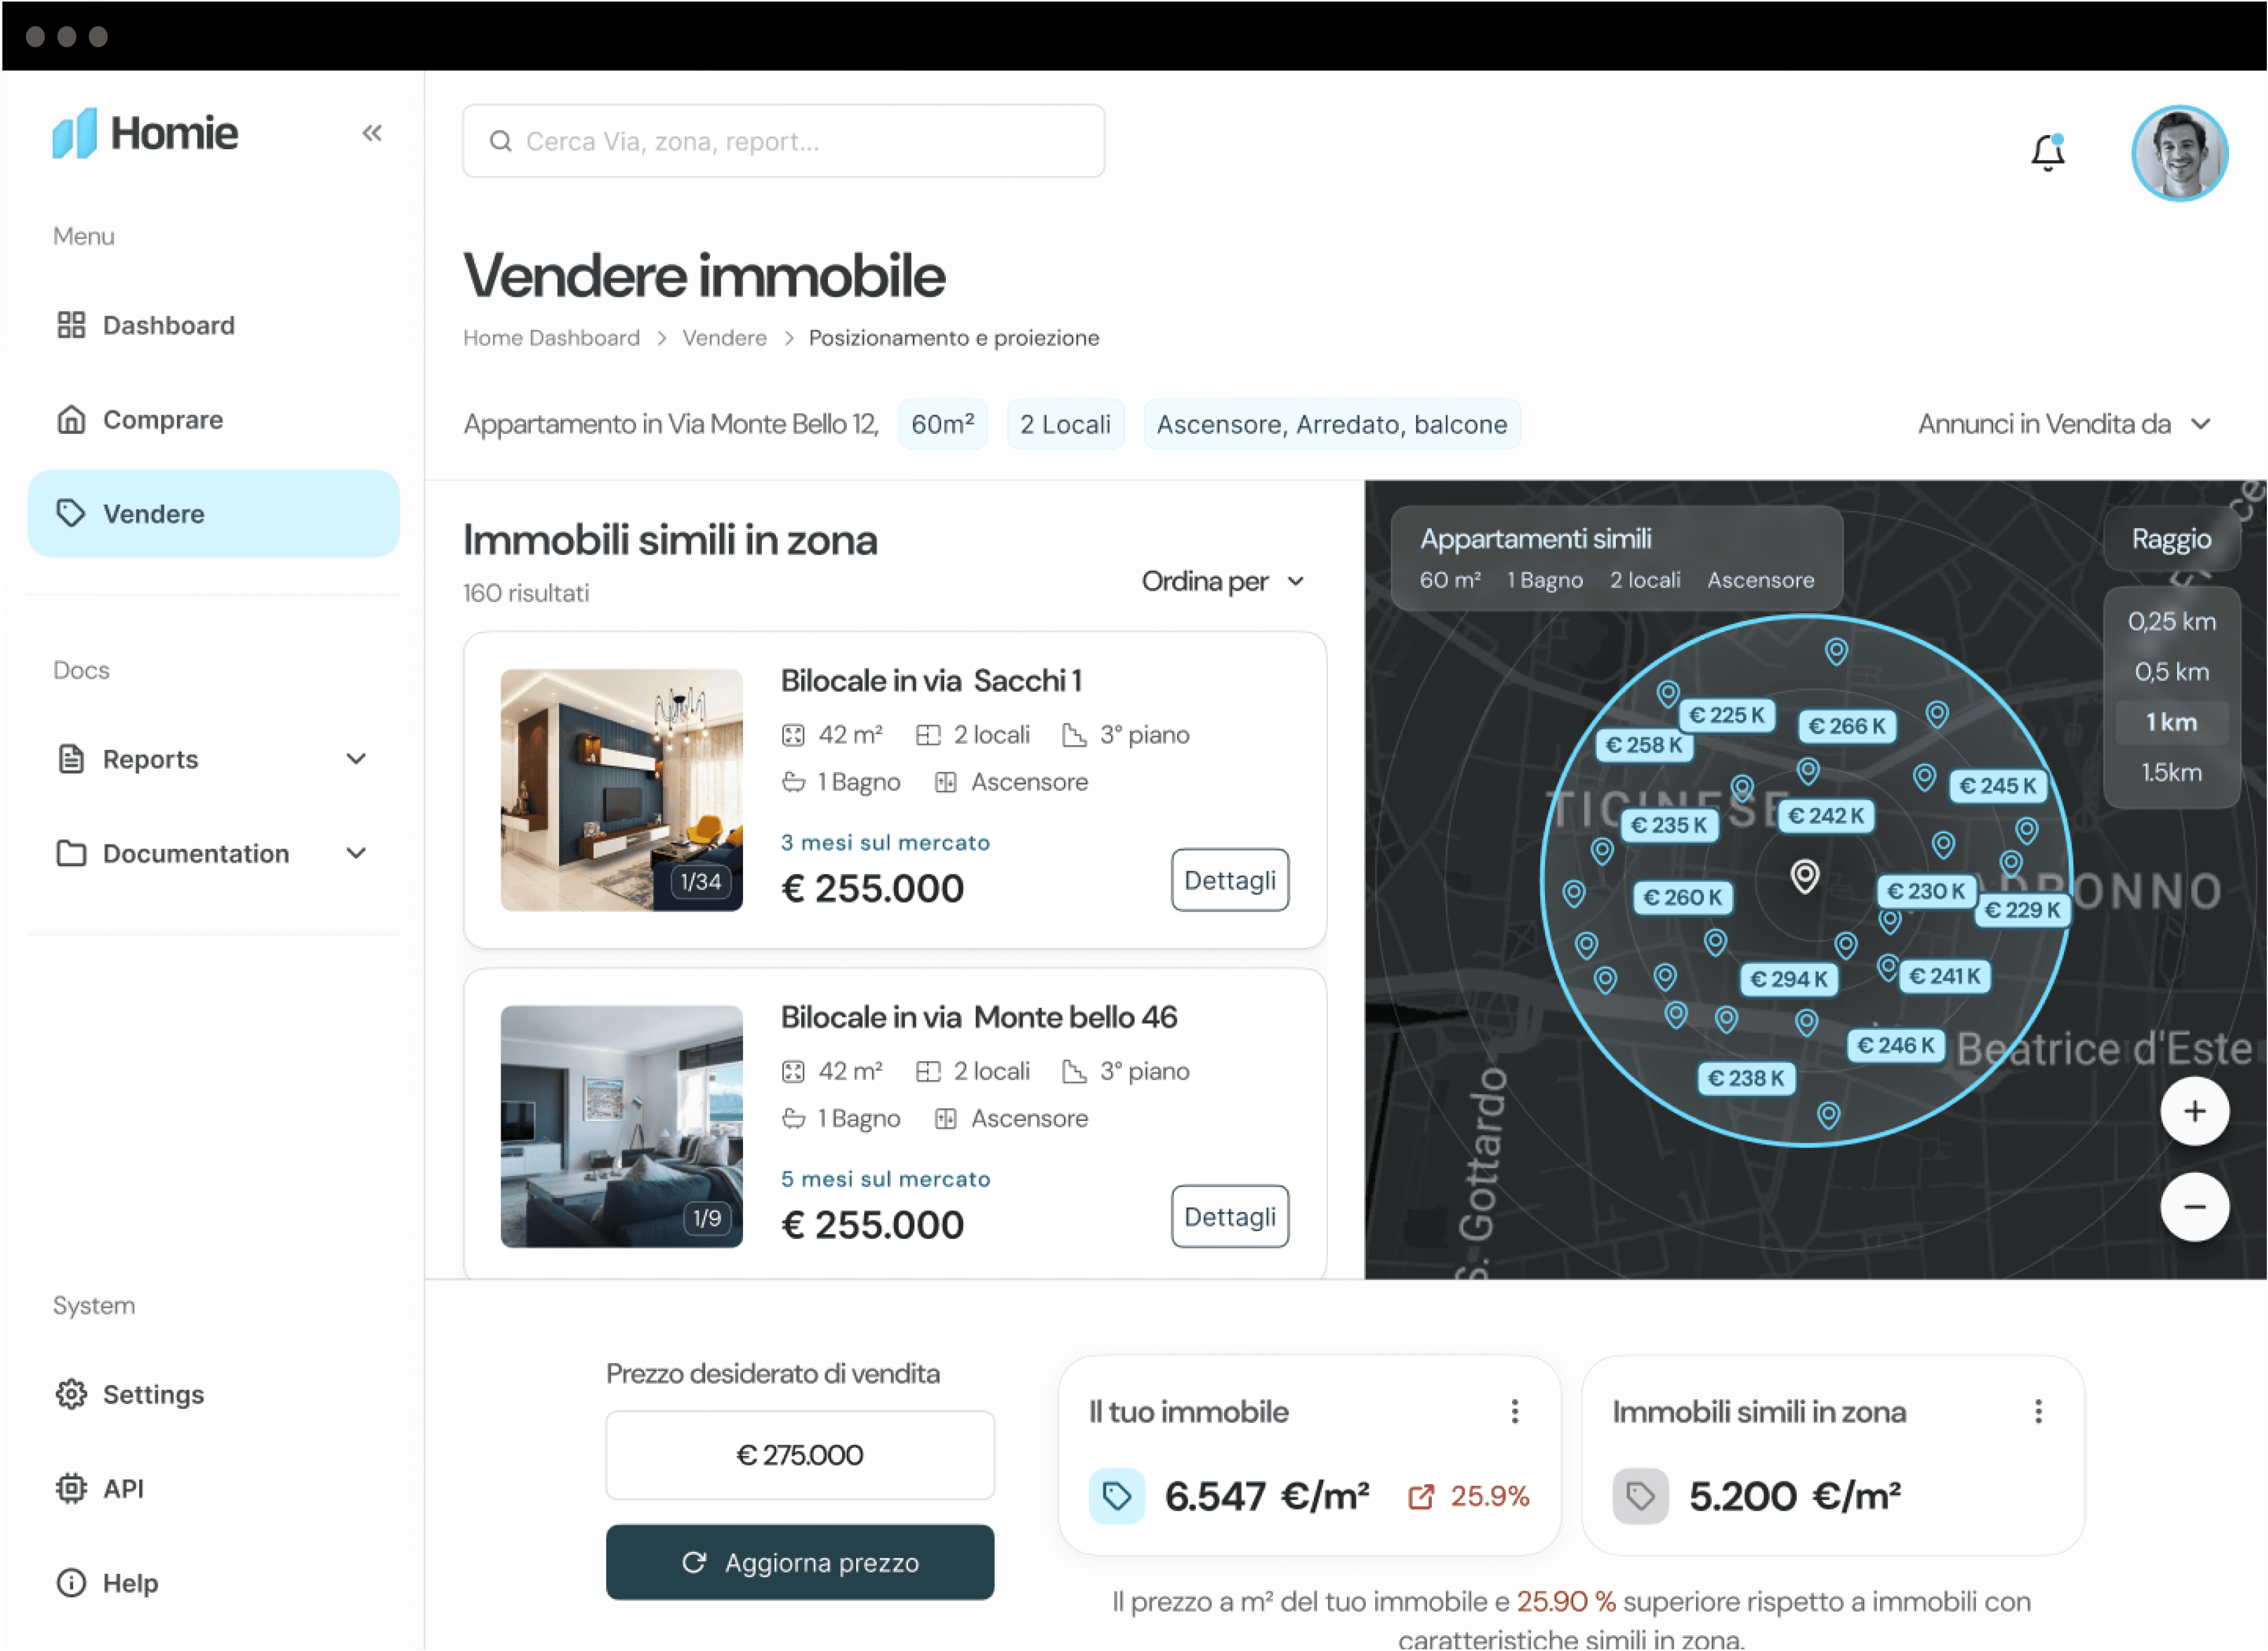
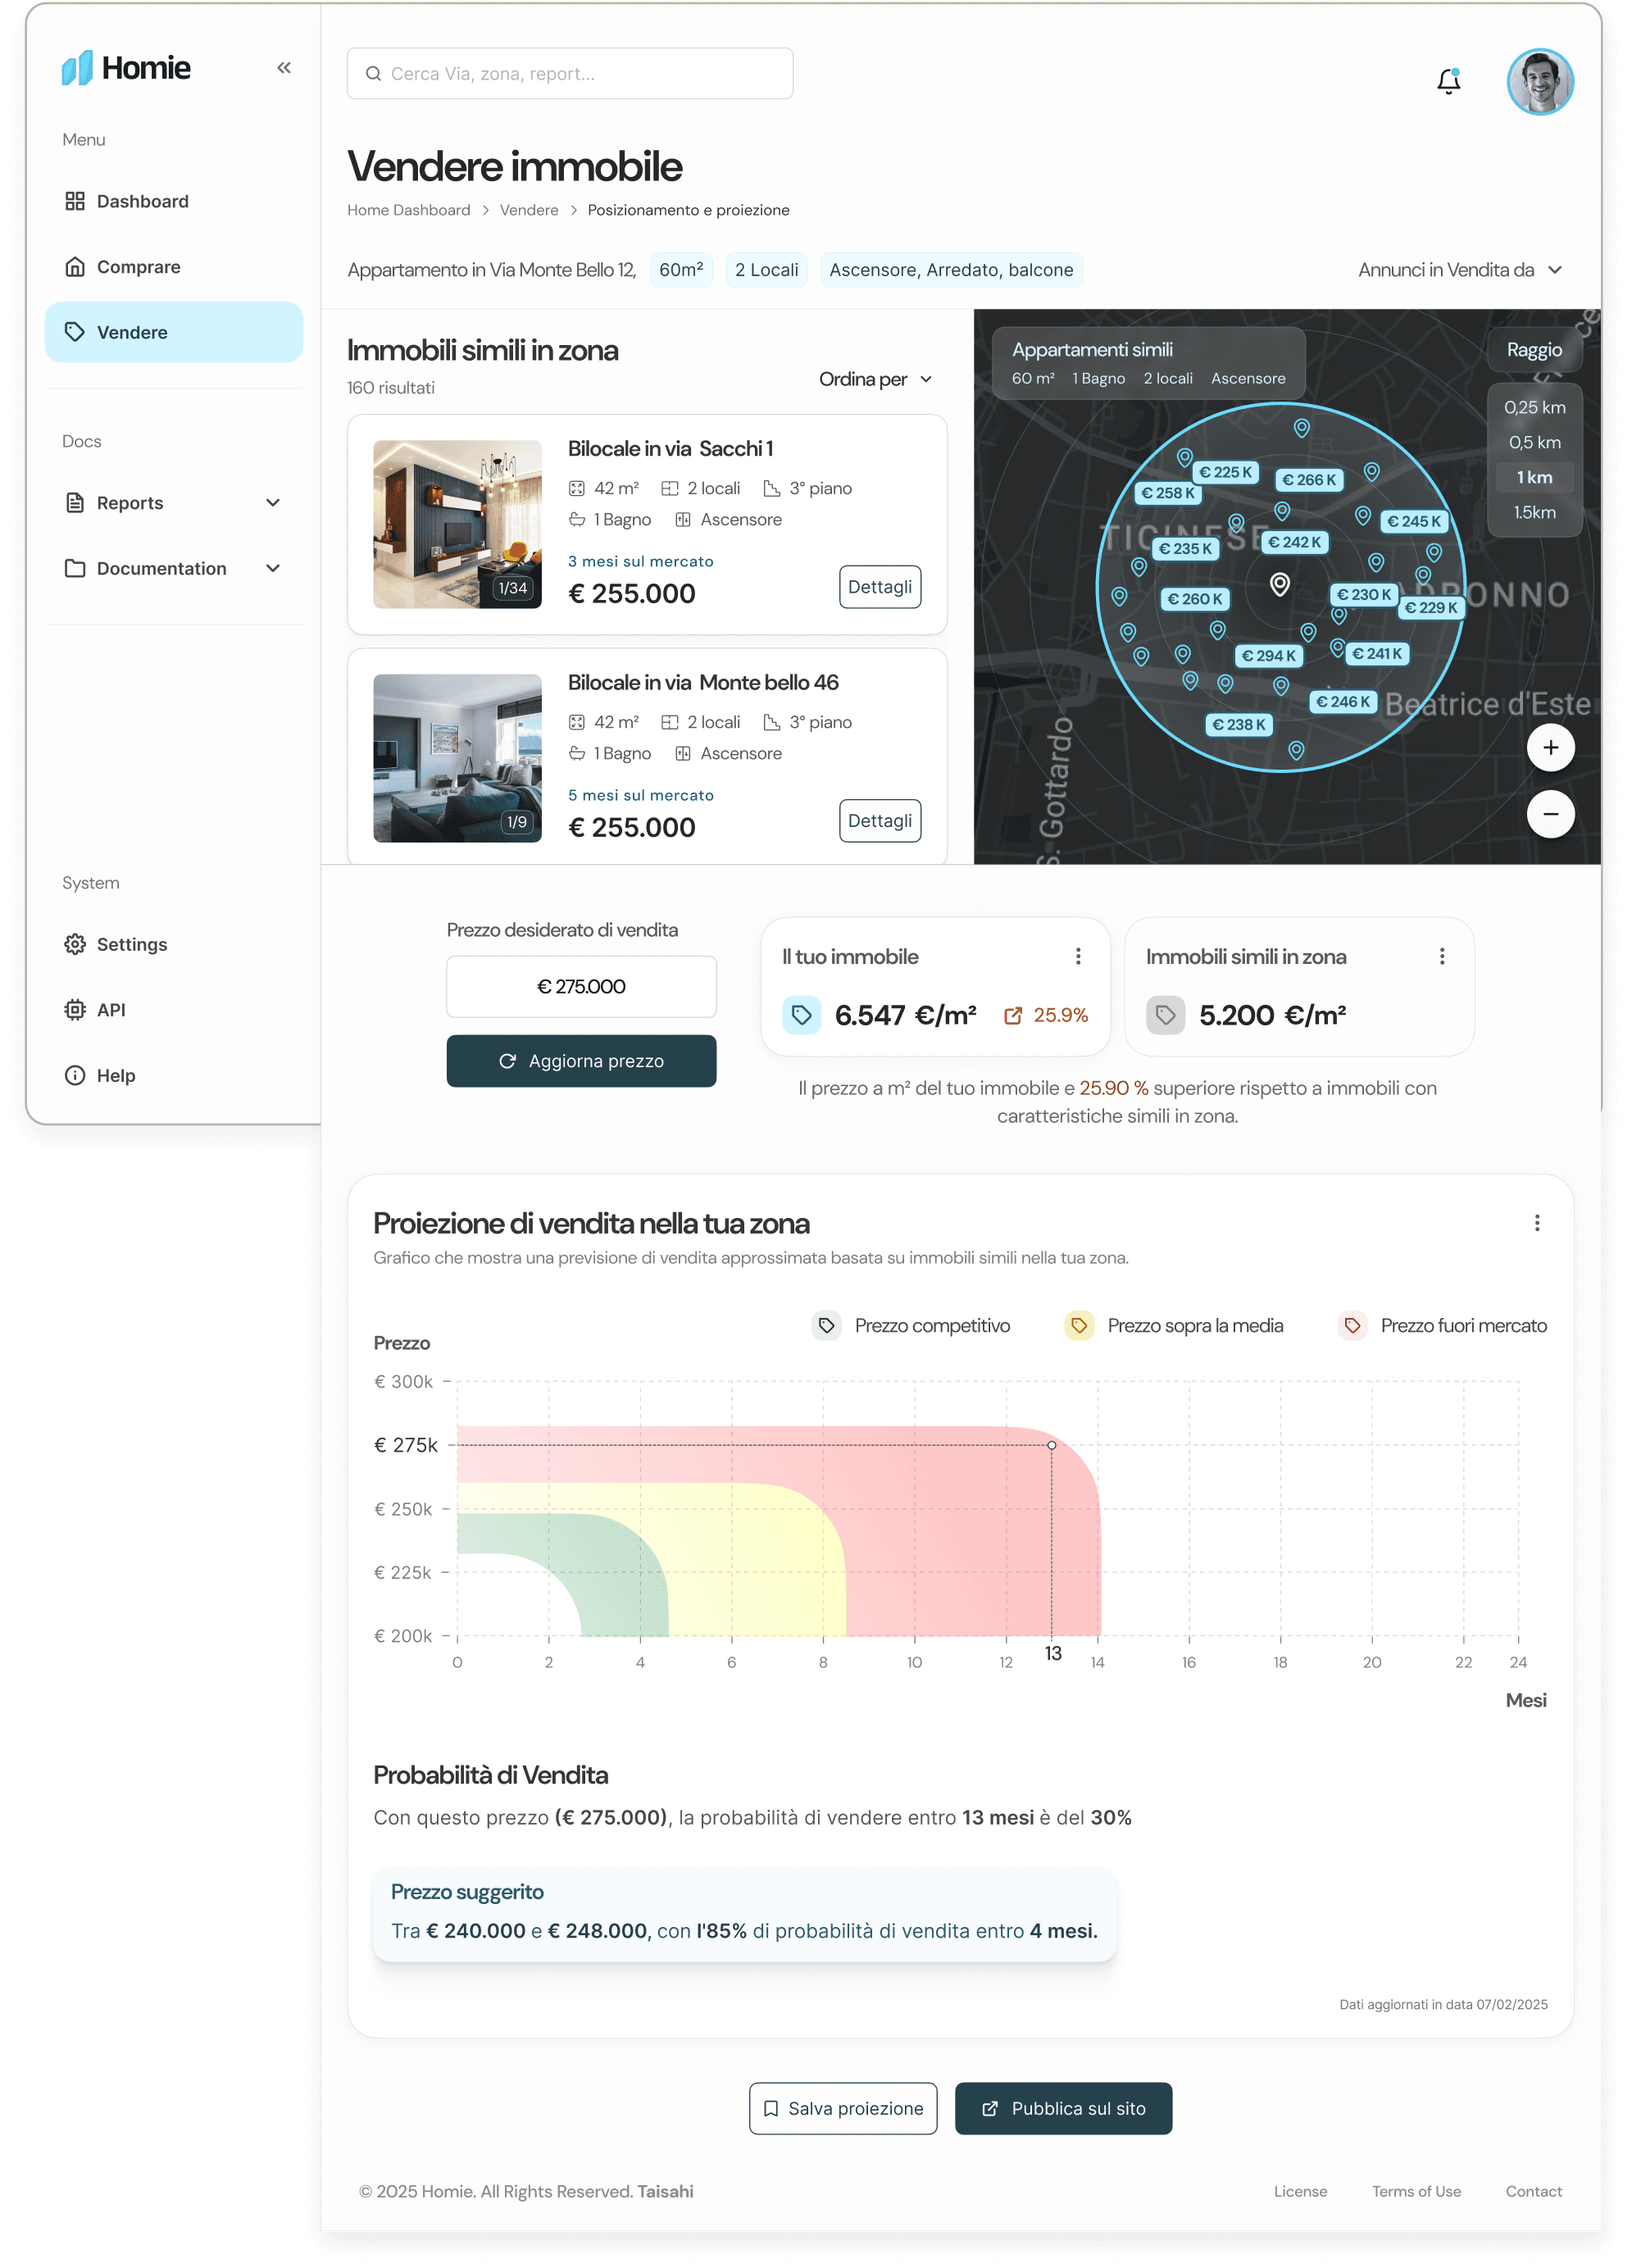
Property sales Projection

Homie’s standout feature. It gives agents a clear picture of the market, showing similar properties nearby and how the client’s home stacks up. Homie’s algorithm also provides a probabilistic estimate of how long the property might take to sell at a given price, along with a recommended price range based on location, market trends, and property performance.

Core UIs

Create Value

Usability testing uncovered where users needed a better experience

Home Dashboard

home dashboard showing section to enhance in red

Before

Cluttered action history complicates navigation

Cluttered action history complicates navigation

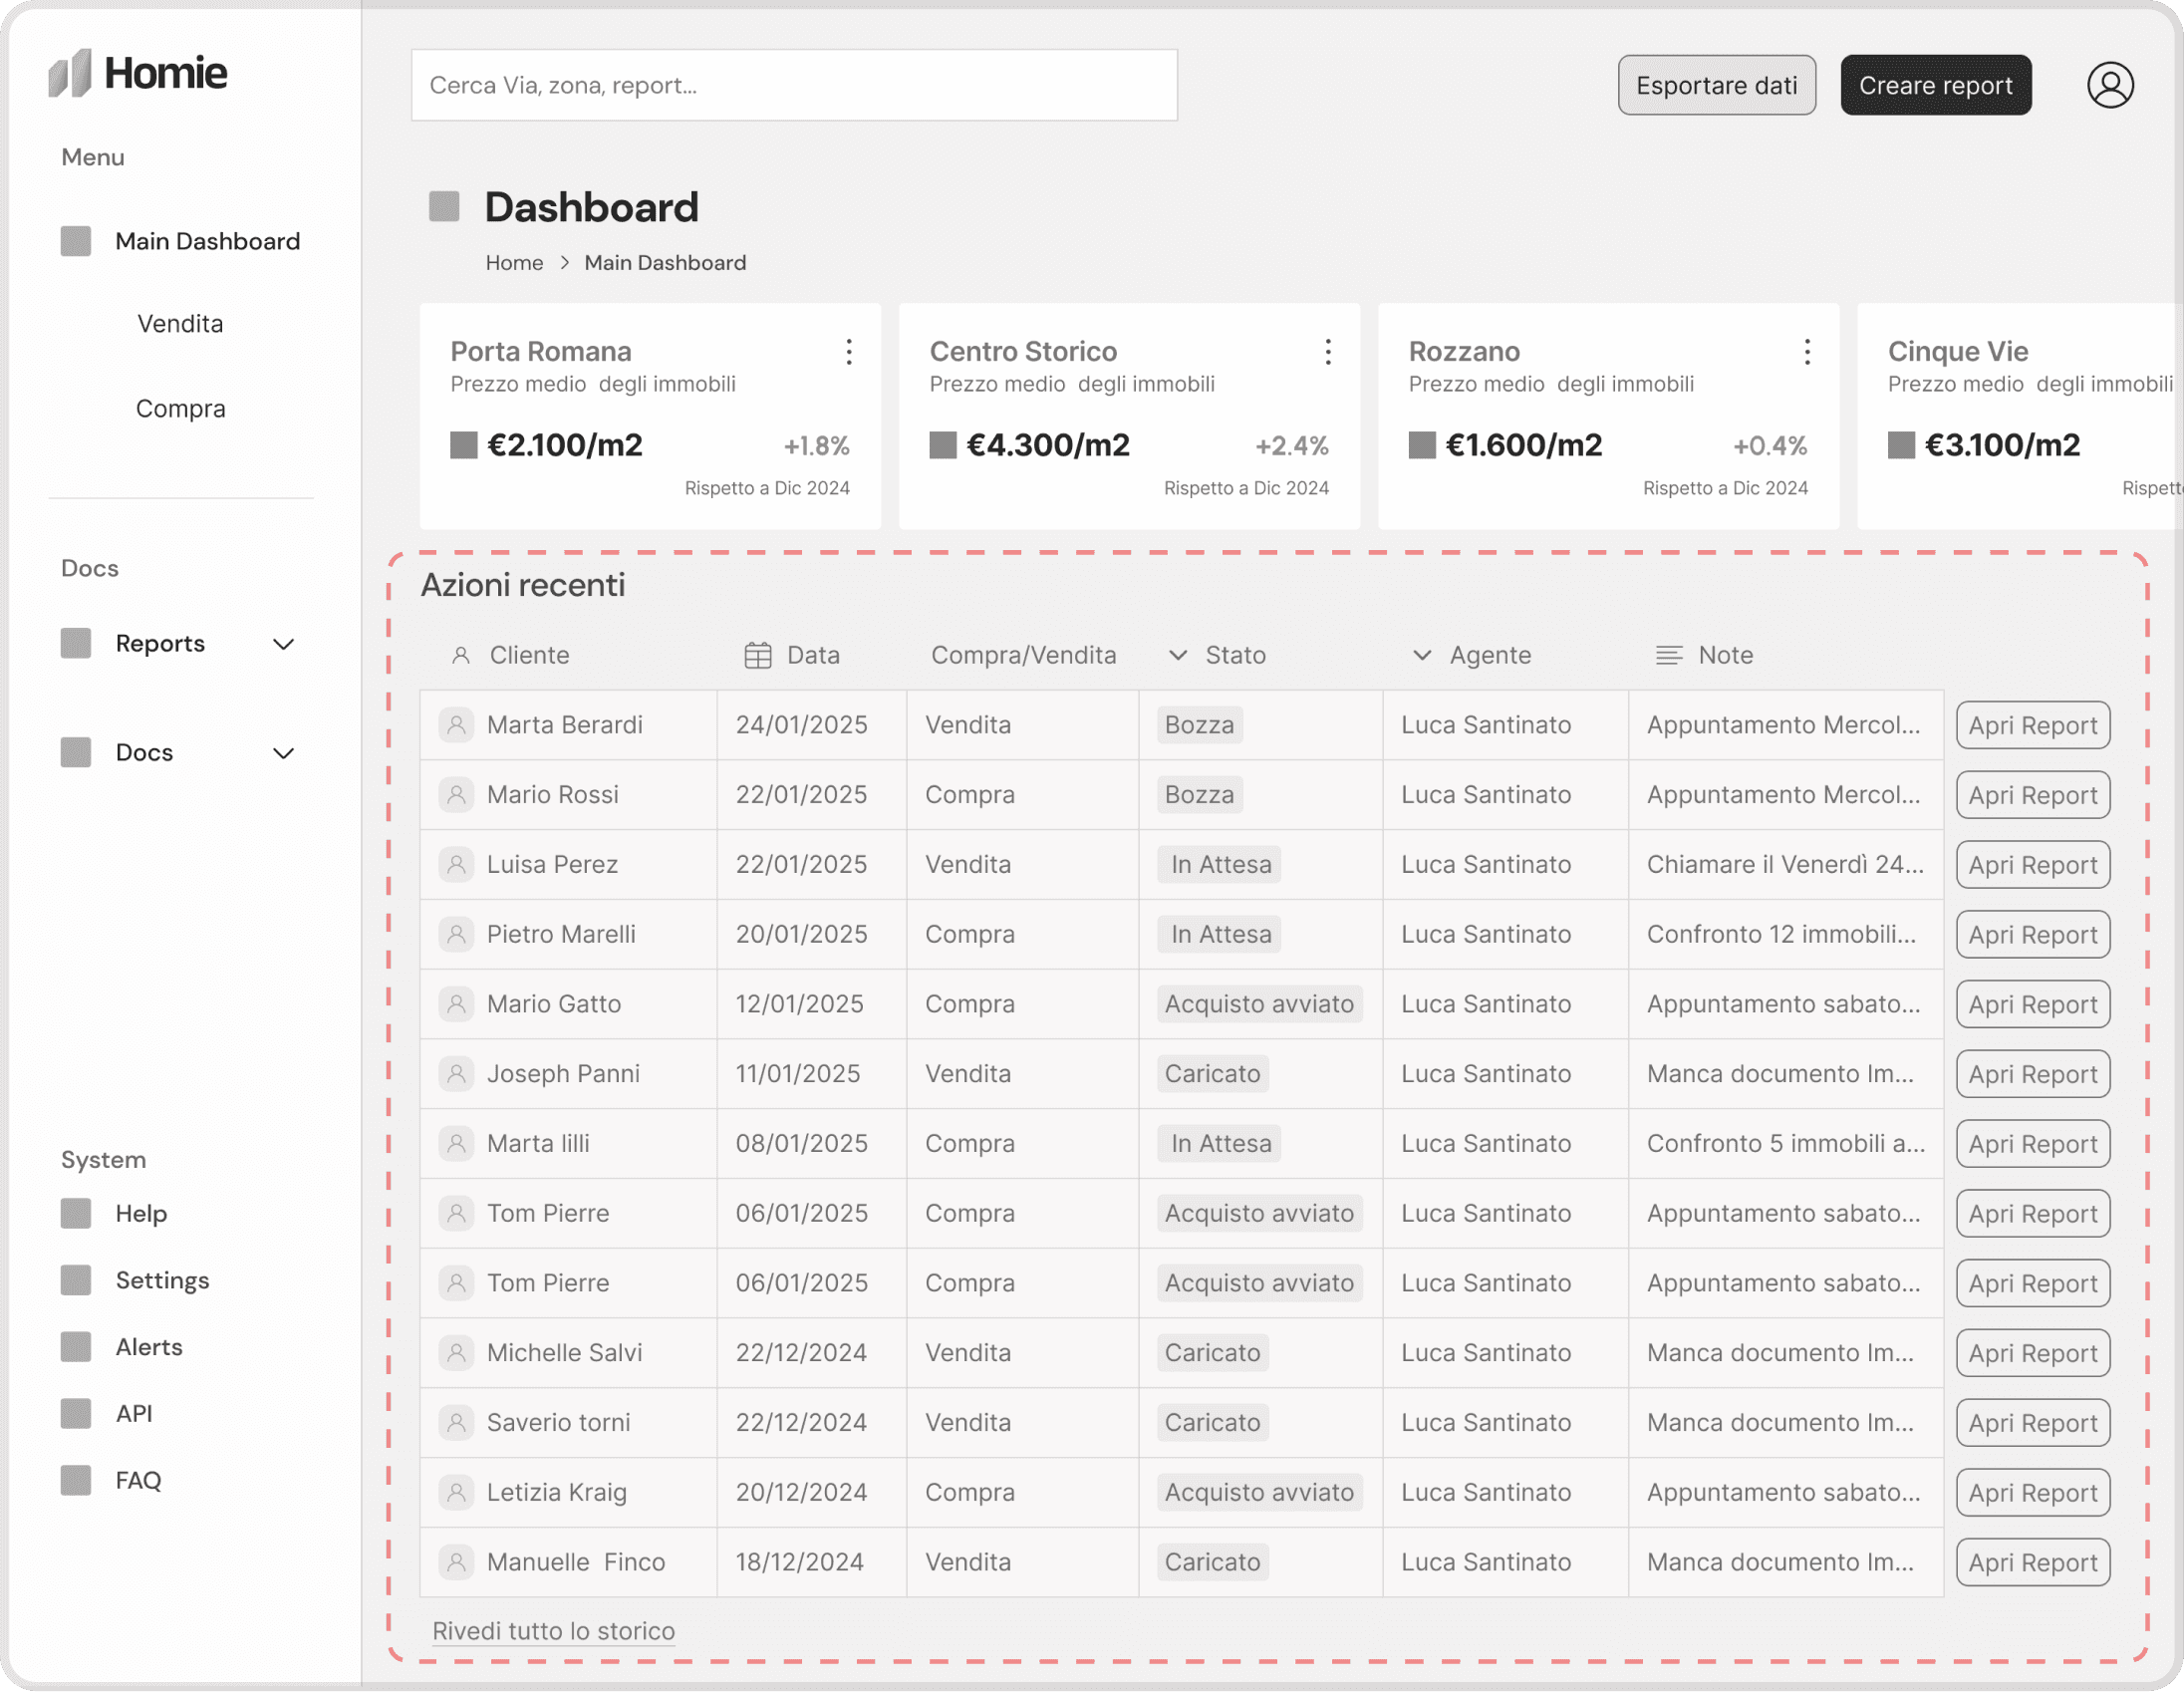
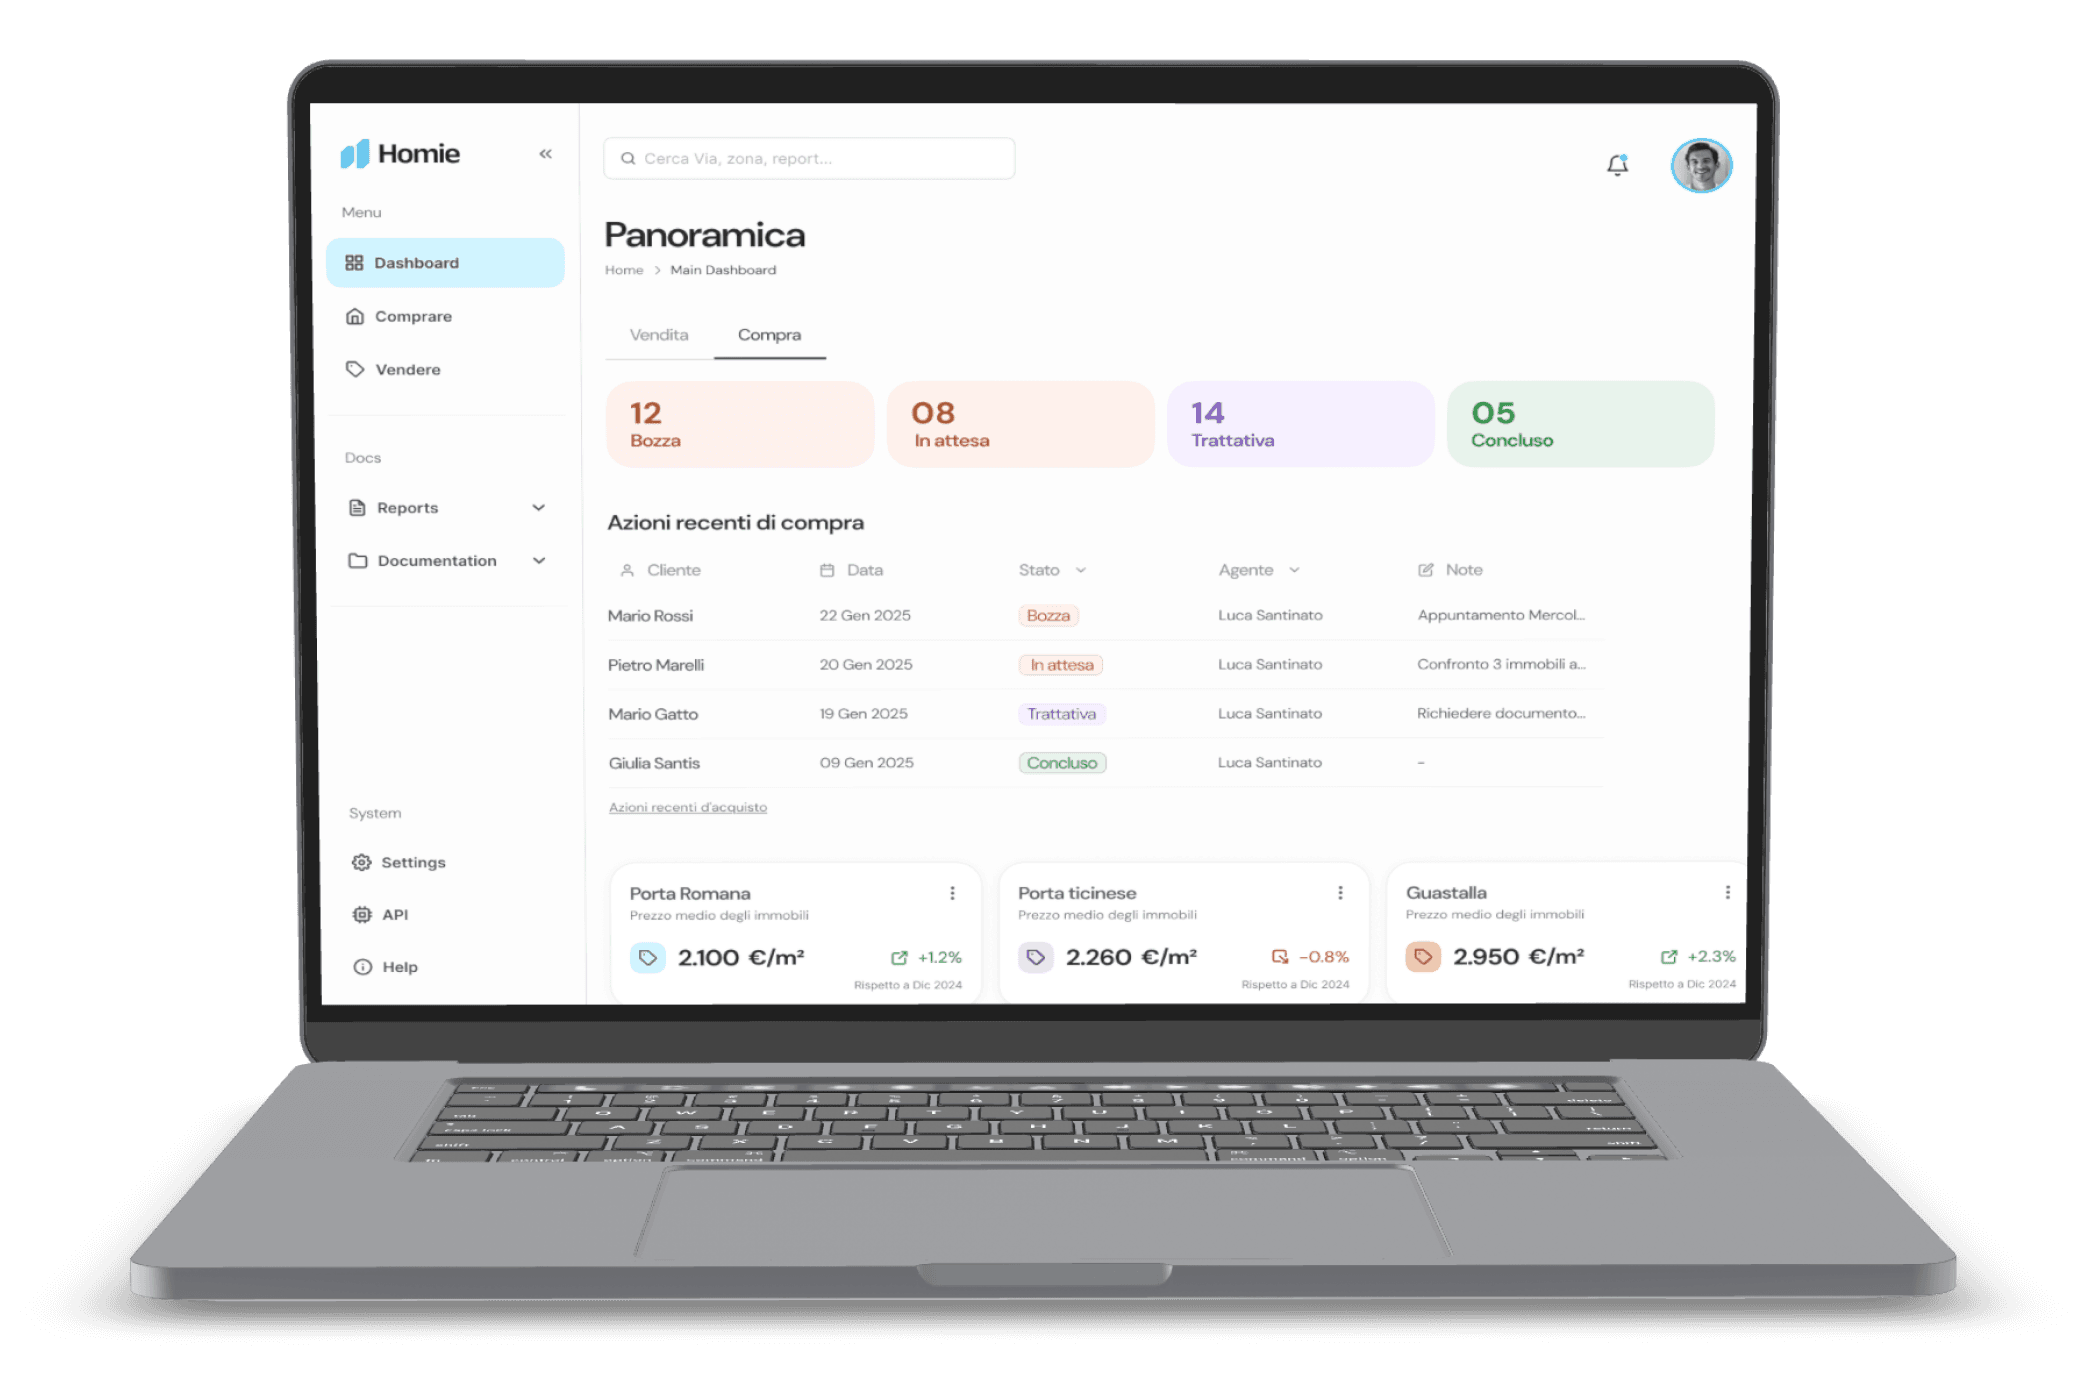
3 out of 6 users found the action history cluttered and hard to navigate when managing multiple clients. 2 suggested separating buyer-related actions from seller-related actions.

Home Dashboard (Before)

Home Dashboard (After)

home dashboard showing section enhanced in green

After

Buy and sell displayed separately for clarity

Buy and sell displayed separately for clarity

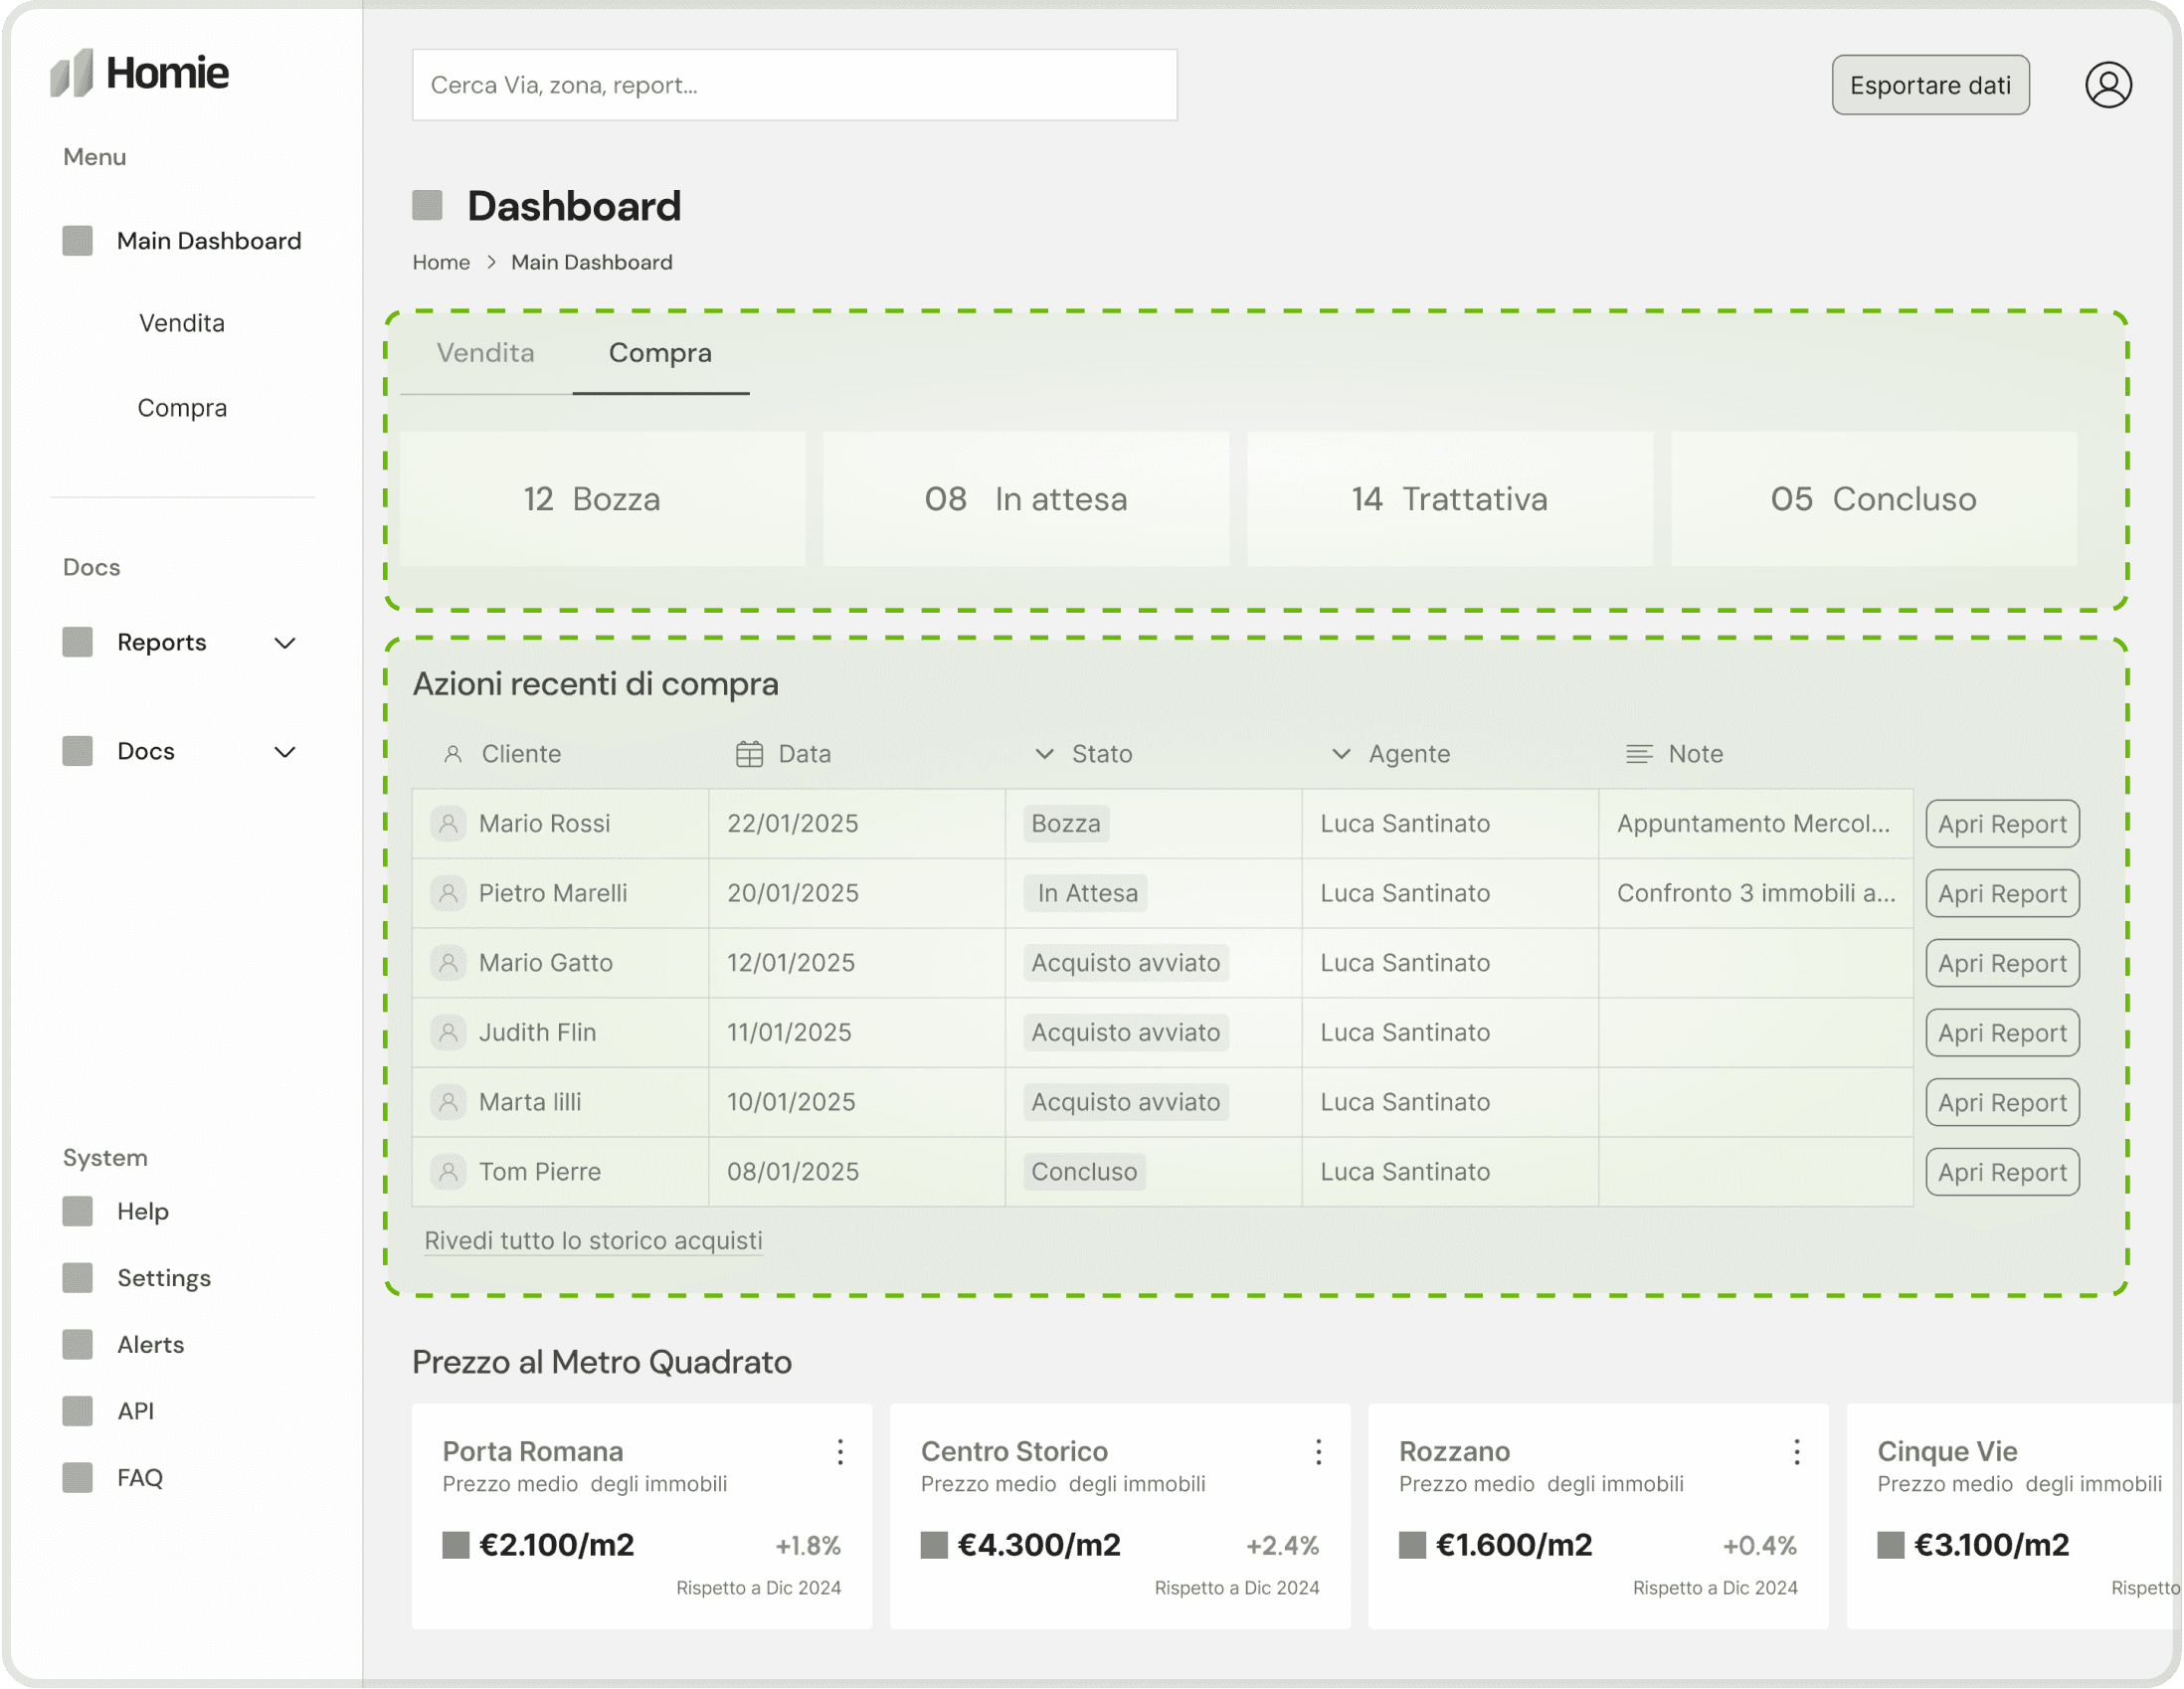
To reduce clutter, I split the dashboard into buy and sell actions. Each tab now shows the relevant history. Also, Agents frequently check action statuses, so having them neatly organized and detailed is key.

Property comparison

Property comparison UI showing in red section that needs refinenments.

Before

Difficulty tracking highlighted properties

Difficulty tracking highlighted properties

2 out of 6 users expressed that it could be challenging to keep track of highlighted properties in a long comparison list

Public transport distance adds significant value

Public transport distance adds significant value

3 out of 6 users would appreciate a visualization of the distance to public transport when comparing properties.

Property comparison (Before)

Property comparison UI showing  in green enhanced area

After

I considered two features and an API integration

I considered two features and an API integration

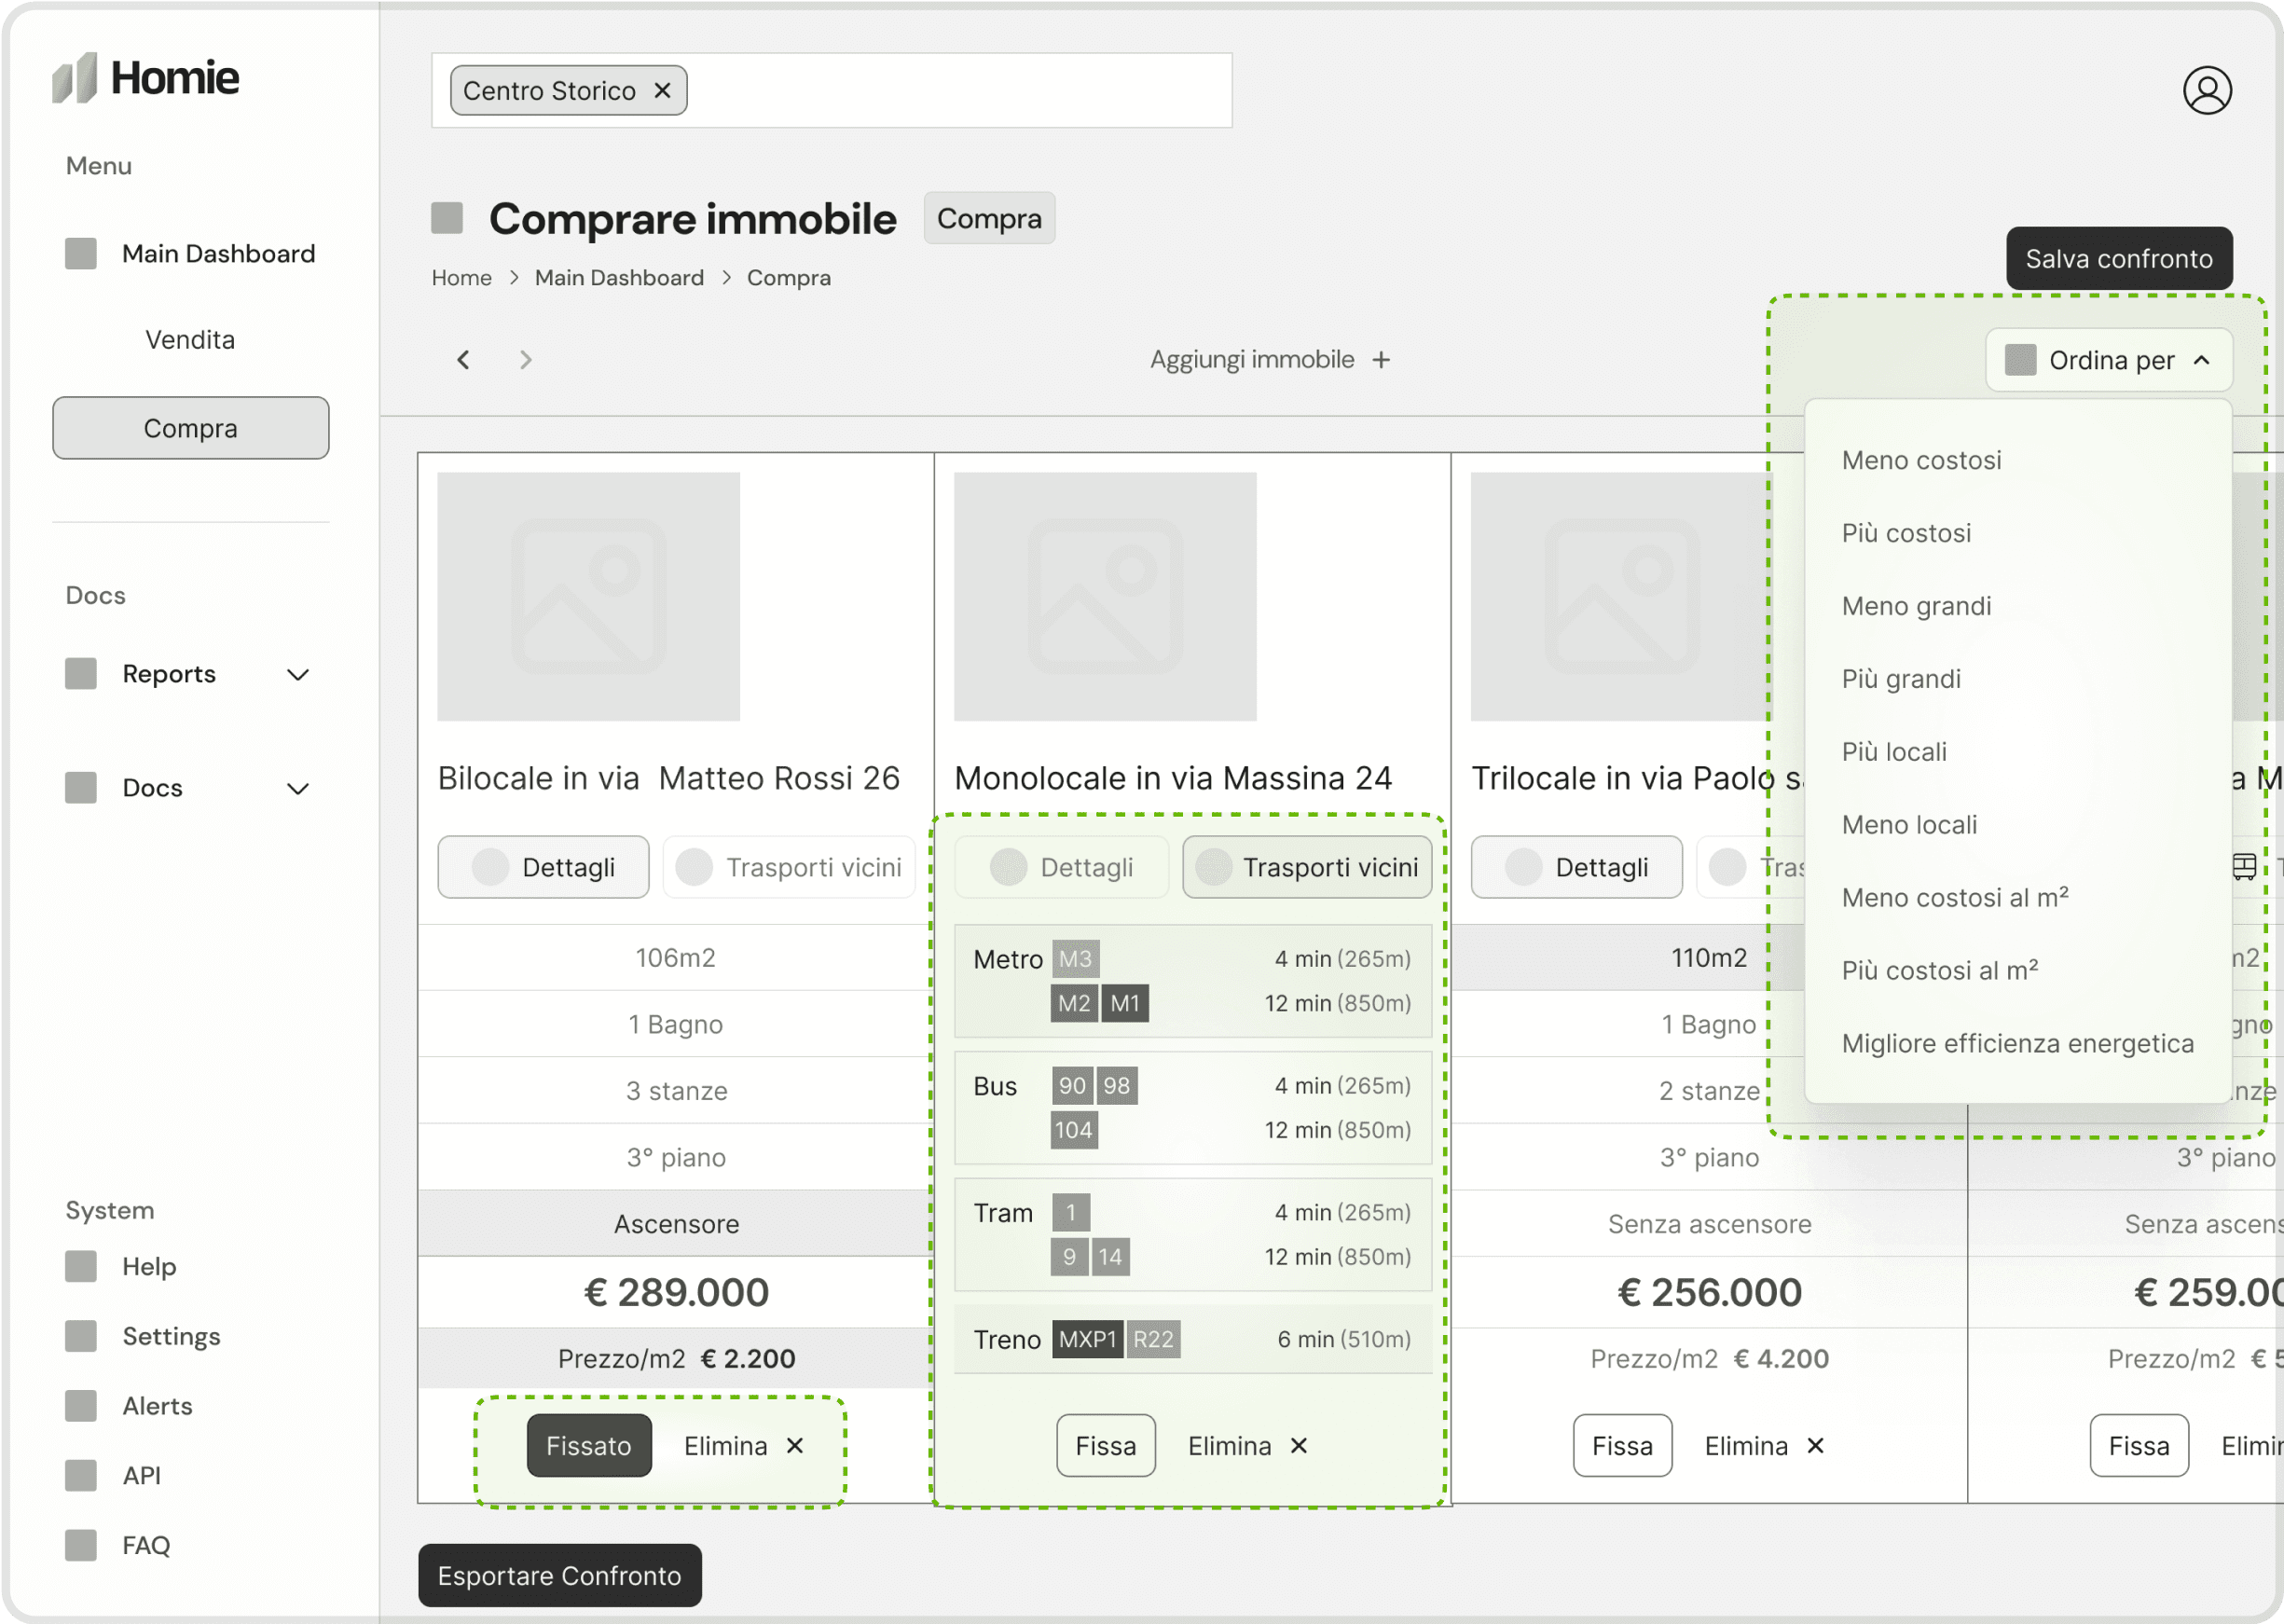
A pin button to keep the properties visible at the beginning and a dropdown to sort them by relevant attributes.

Since locations are known, Google Maps’ API could help map out transit options and distances. Decided to include it in this iteration.

Property comparison (After)

Property Sales projection

property sales projection UI showing inn red area that needs improvements

Before

Missing time-on-market data creates false expectations

Missing time-on-market data creates false expectations

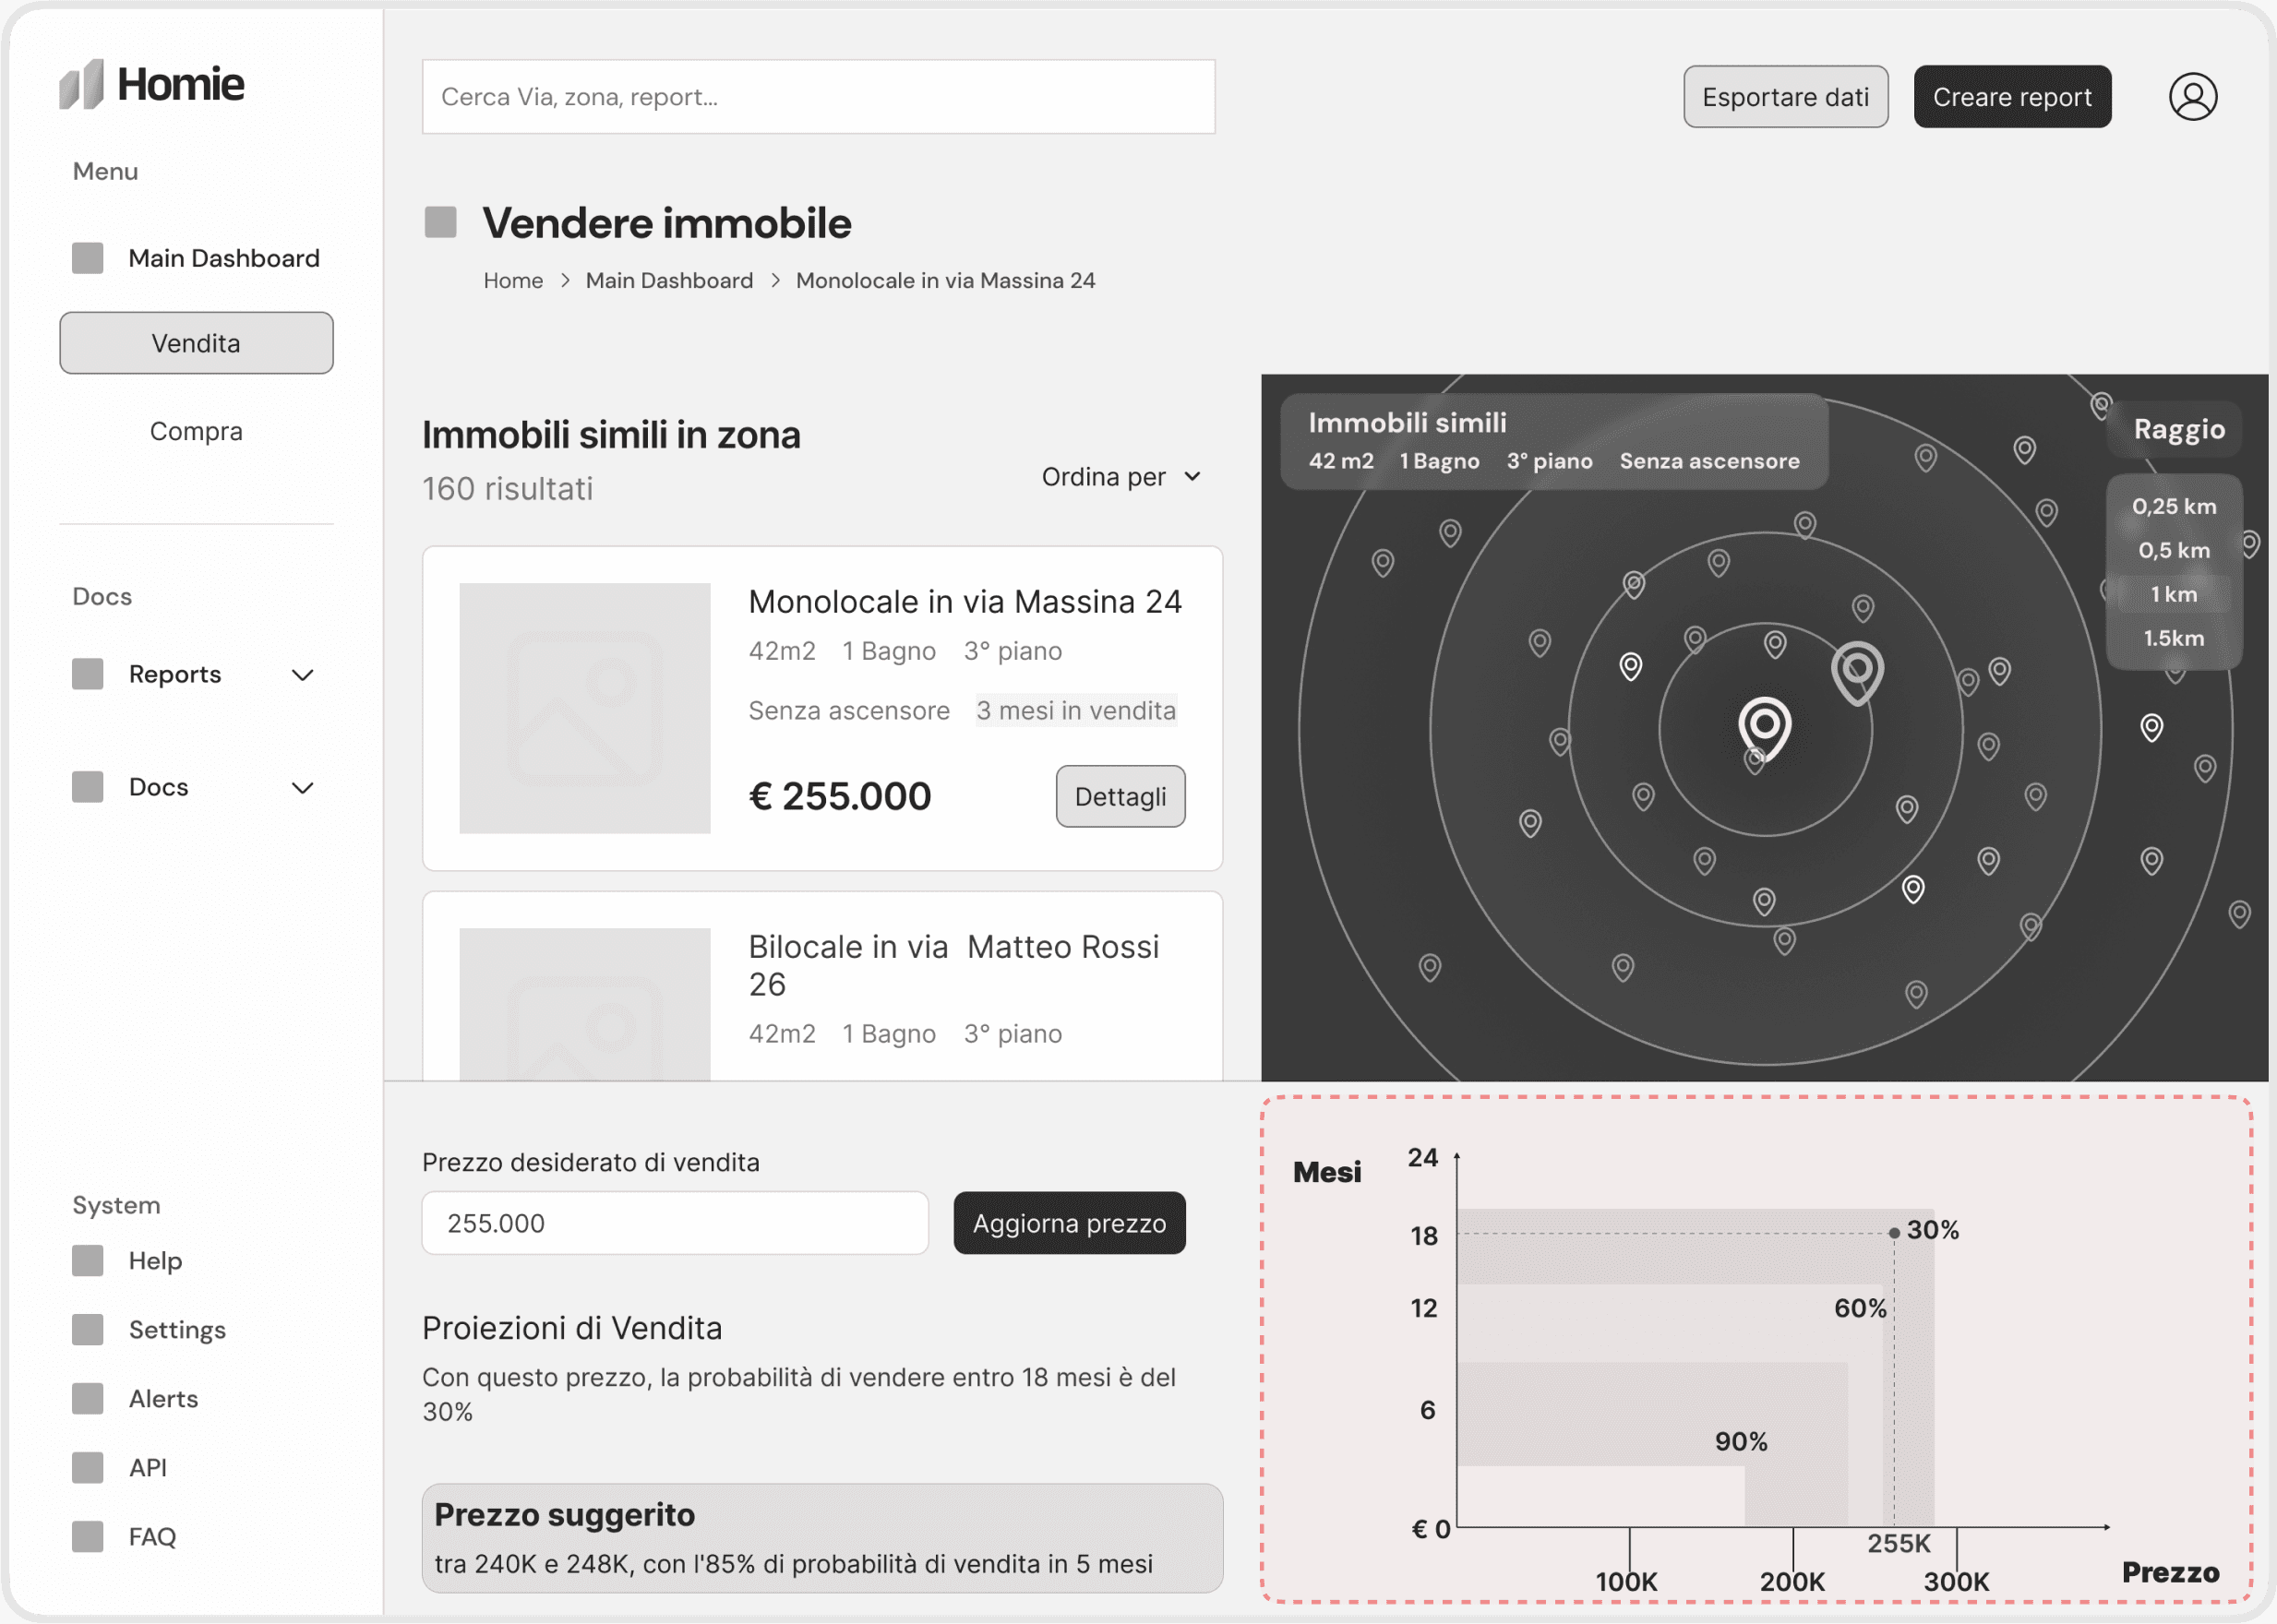
2 out of 6 users felt that displaying properties on the map without showing how long they’ve been on the market could lead to misleading client expectations and affect decision-making.

Sales projection graph lacks clarity and actionable insights

Sales projection graph lacks clarity and actionable insights

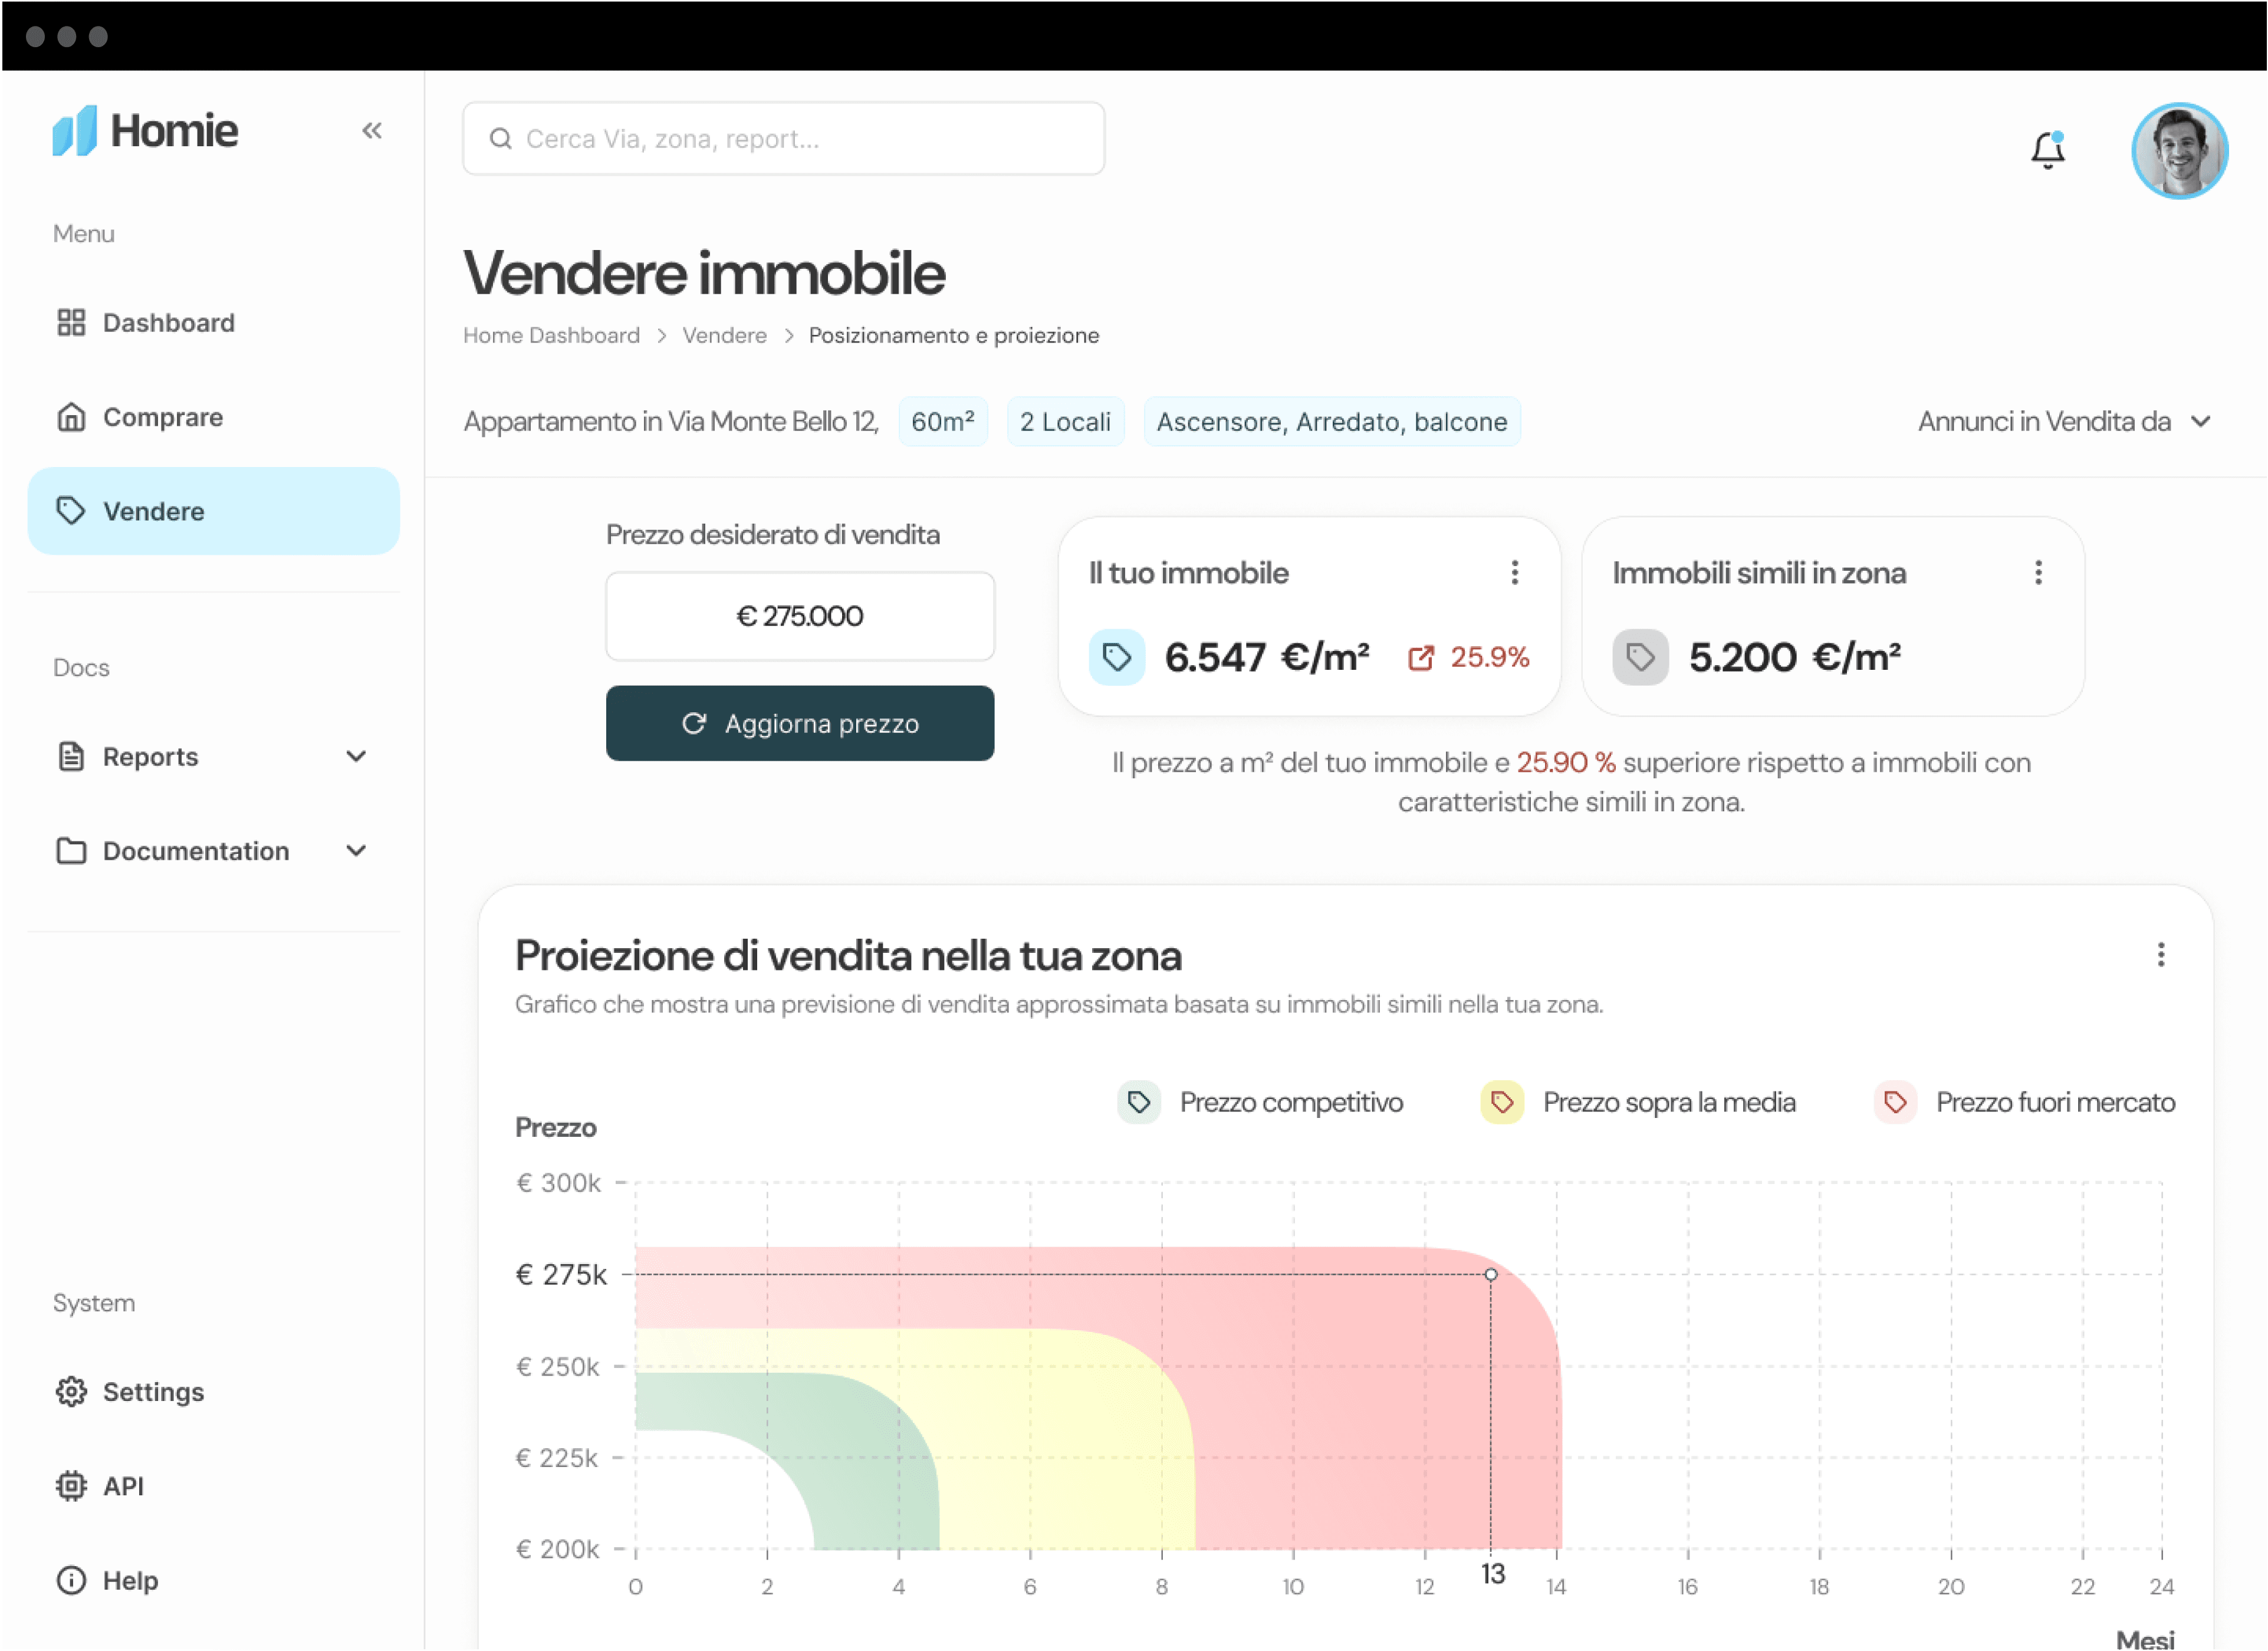
The sales projection graph was confusing for 3 out of 6 users, who felt it lacked actionable insights, with one remarking, ‘I don’t get what the bars represent. Moreover, 2 users mentioned that showing KPIs comparing the property’s price to the local market would be a valuable addition.

Property Sales projection (Before)

Property Sales projection (After)

sales projection UI showing the improvements made after usability studies

After

Agents can now filter properties by time on the market. A new menu sorts listings by publication time.

The updated graph provides more context showing competitive price ranges, above-average prices, and outliers. The UI also compares the client’s price per m² with the area average.
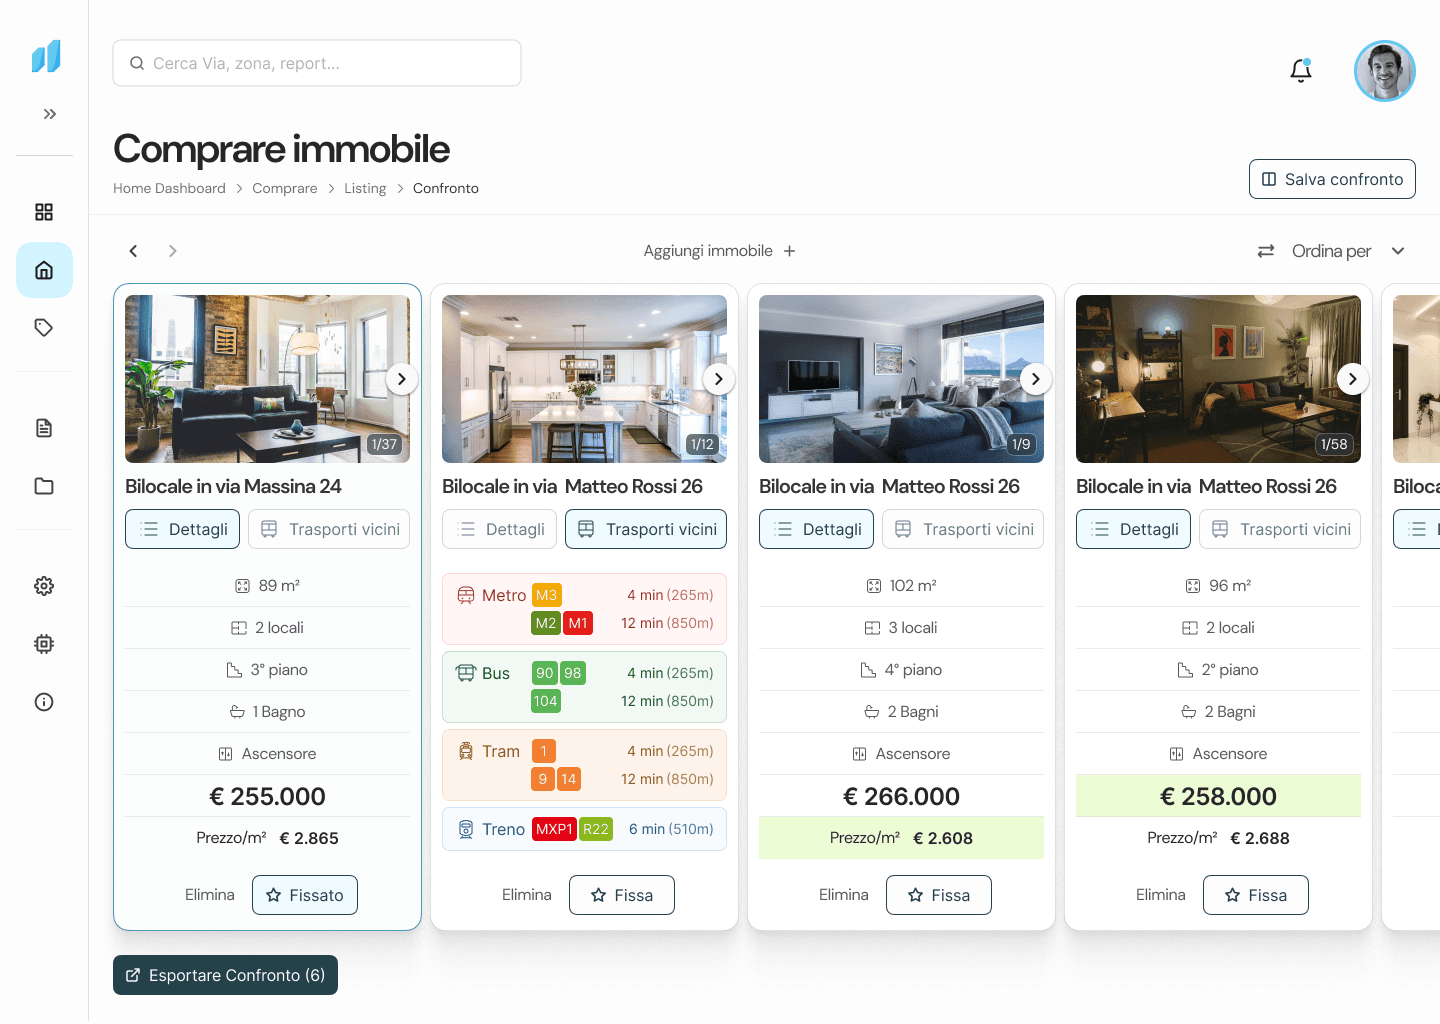
Create Value

High fidelity wireframes

Speeding up the process using Figma’s design system and tweaking components to align with Homie’s branding.

  • Home Dashboard (Compra)

    High fidelity home dashboard
  • Buyer Preferences: Tailor Your Search

    High fidelity input fields
  • Property Explorer: Map & List View

    High fidelity property listing
  • Property Explorer (properties selected)

    High fidelity property listing with 4 properties selected
  • Side-by-Side Comparison UI

    property comparison UI in high fidelity
  • Home Dashboard (Vendita)

    home dashboard with buy tab selected
  • Property details

    input fields UI from buy flow
  • Market Insights & Pricing Strategy

    High fidelity sales projection UI

Impact & Next steps

Homie started as an experiment: An idea to solve a problem in the RE industry.

What I didn’t expect was the agents’ reaction. Their feedback was eye-opening

💬 "Comparing properties like this would save me so much time."

💬 "Comparing properties like this would save me so much time."

💬 "Comparing properties like this would save me so much time."

💬 "Showing a seller that their price is off the market in seconds would be a game-changer."

💬 "Showing a seller that their price is off the market in seconds would be a game-changer."

💬 "Showing a seller that their price is off the market in seconds would be a game-changer."

If Homie were launched in the market, the next step would be to measure its impact through key metrics

less time comparing properties (DOM), more closed deals (CR), happier clients (NPS and Customer Satisfaction), and fewer overpriced homes (Visits per Sale Ratio).

less time comparing properties (DOM), more closed deals (CR), happier clients (NPS and Customer Satisfaction), and fewer overpriced homes (Visits per Sale Ratio).

less time comparing properties (DOM), more closed deals (CR), happier clients (NPS and Customer Satisfaction), and fewer overpriced homes (Visits per Sale Ratio).

But this is just the beginning. While Homie was designed for Milan, its core concept is scalable. With the right data, it could expand across Italy, or even Europe, offering real-time market intelligence and advanced automation. Flows like onboarding, report exports, API integrations, and mobile adaptation are still on the roadmap.

image mockup of a laptop showing homie dashboard on the screen

Retrospective

When one approach fails, a new angle might be the key

This project taught me a lot, especially about connecting with specific users. Getting interviews with real estate agents was a HUGE challenge, many didn’t respond or assumed I was selling a digital product(maybe in the future 😎).

This project taught me a lot, especially about connecting with specific users. Getting interviews with real estate agents was a HUGE challenge, many didn’t respond or assumed I was selling a digital product(maybe in the future 😎).

This project taught me a lot, especially about connecting with specific users. Getting interviews with real estate agents was a HUGE challenge, many didn’t respond or assumed I was selling a digital product(maybe in the future 😎).

Frustrated, I changed my approach: instead of pitching a SaaS concept, I introduced myself as a "student" working on a "final course project." This shift worked. Agents opened up, sharing their pain points like time wasted on manual comparisons and awkward price negotiations. Their feedback was crucial in shaping Homie into a tool that solves real problems.

Frustrated, I changed my approach: instead of pitching a SaaS concept, I introduced myself as a "student" working on a "final course project." This shift worked. Agents opened up, sharing their pain points like time wasted on manual comparisons and awkward price negotiations. Their feedback was crucial in shaping Homie into a tool that solves real problems.

Frustrated, I changed my approach: instead of pitching a SaaS concept, I introduced myself as a "student" working on a "final course project." This shift worked. Agents opened up, sharing their pain points like time wasted on manual comparisons and awkward price negotiations. Their feedback was crucial in shaping Homie into a tool that solves real problems.

It’s all about the research

The real estate sector has always fascinated me, and while having an idea to solve a problem in this field was one thing, developing it into a viable solution was another. I spent countless hours researching—not just to validate my concept but to build a solid understanding of the Italian real estate market. In the end, UX research made up nearly 70% of my work on this project. That’s how Homie went from ‘just an idea’ to something they could actually use.

The real estate sector has always fascinated me, and while having an idea to solve a problem in this field was one thing, developing it into a viable solution was another. I spent countless hours researching—not just to validate my concept but to build a solid understanding of the Italian real estate market. In the end, UX research made up nearly 70% of my work on this project. That’s how Homie went from ‘just an idea’ to something they could actually use.

The real estate sector has always fascinated me, and while having an idea to solve a problem in this field was one thing, developing it into a viable solution was another. I spent countless hours researching—not just to validate my concept but to build a solid understanding of the Italian real estate market. In the end, UX research made up nearly 70% of my work on this project. That’s how Homie went from ‘just an idea’ to something they could actually use.

You didn't scroll all this way for nothing. Let's make it count.

You didn't scroll all this way for nothing. Let's make it count.

You didn't scroll all this way for nothing. Let's make it count.

2025

2025

|

|

All rights reserved

Made with Figma & Framer